This article 'Splunk interview questions' will help you prepare for the interview for a Splunk profile. It will provide you with valuable insights and key topics to boost your chances of success.
The constant growth of IoT devices is fueling an extraordinary surge in machine-generated data. Companies now grapple with storing, managing, processing and extracting valuable insights from these vast data streams. This is where Splunk shines by empowering organizations to access, visualize and analyze machine data from diverse sources, including networks, IoT devices, hardware and servers.
Consequently, the demand for skilled Splunk experts is soaring. To help you navigate the competitive job market, we've compiled a list of top Splunk interview questions and answers. Mastering these will significantly enhance your chances of cracking your next Splunk interview and securing your desired role.

If you are a fresher who has recently completed their Splunk classes, then here are some of the best interview questions for you.
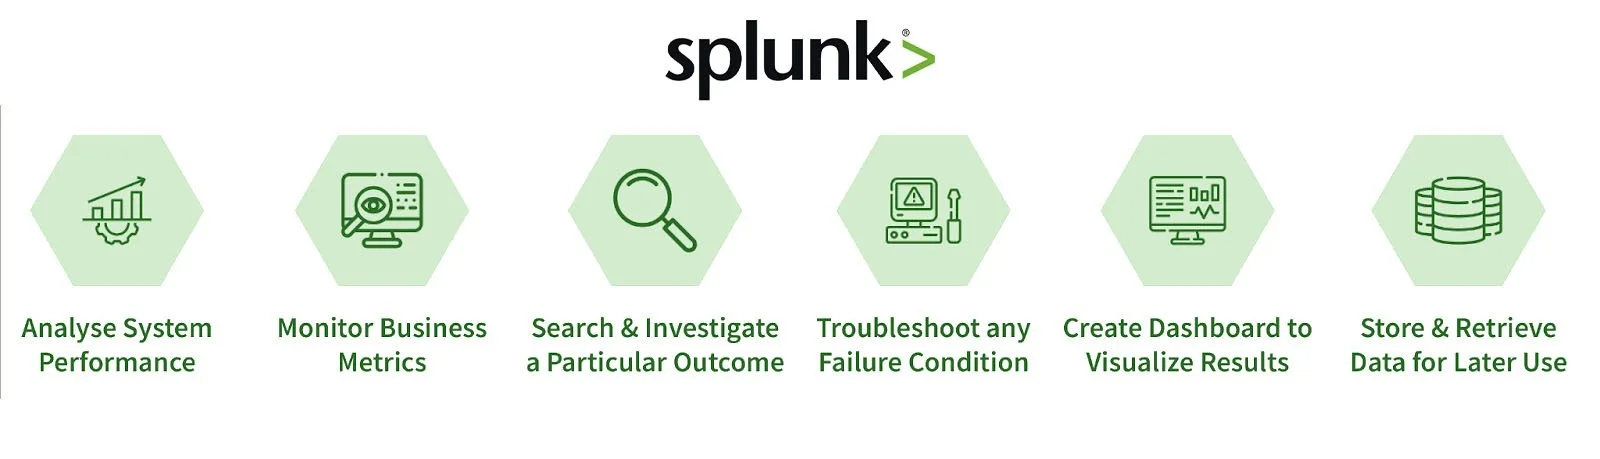
Machine data is not an easy feat to understand since it is in an unstructured format. Thus, analyzing and visualizing this data is not possible. Splunk is the tool that helps in such situations. It is the perfect tool to tackle these problems because -

Splunk Architecture has three main components -
It is very beneficial when data enters a Splunk instance via forwarders. These benefits include an encrypted SSL connection between the indexer and the forwarder, a TCP connection and bandwidth throttling. Data forwarded to the indexers are by default load balanced. This means that even if one indexer fails at a point, data can be routed to a different indexer instance swiftly.
Splunk Query enables the running of a specific operation on machine-generated data. It uses SPL or Search Processing Language to communicate with a source or database of data. This language is full of functions, commands, arguments, etc., that can be utilized for extracting essential info from machine-generated data. Hence, enabling the users to run queries to be able to analyze their data.
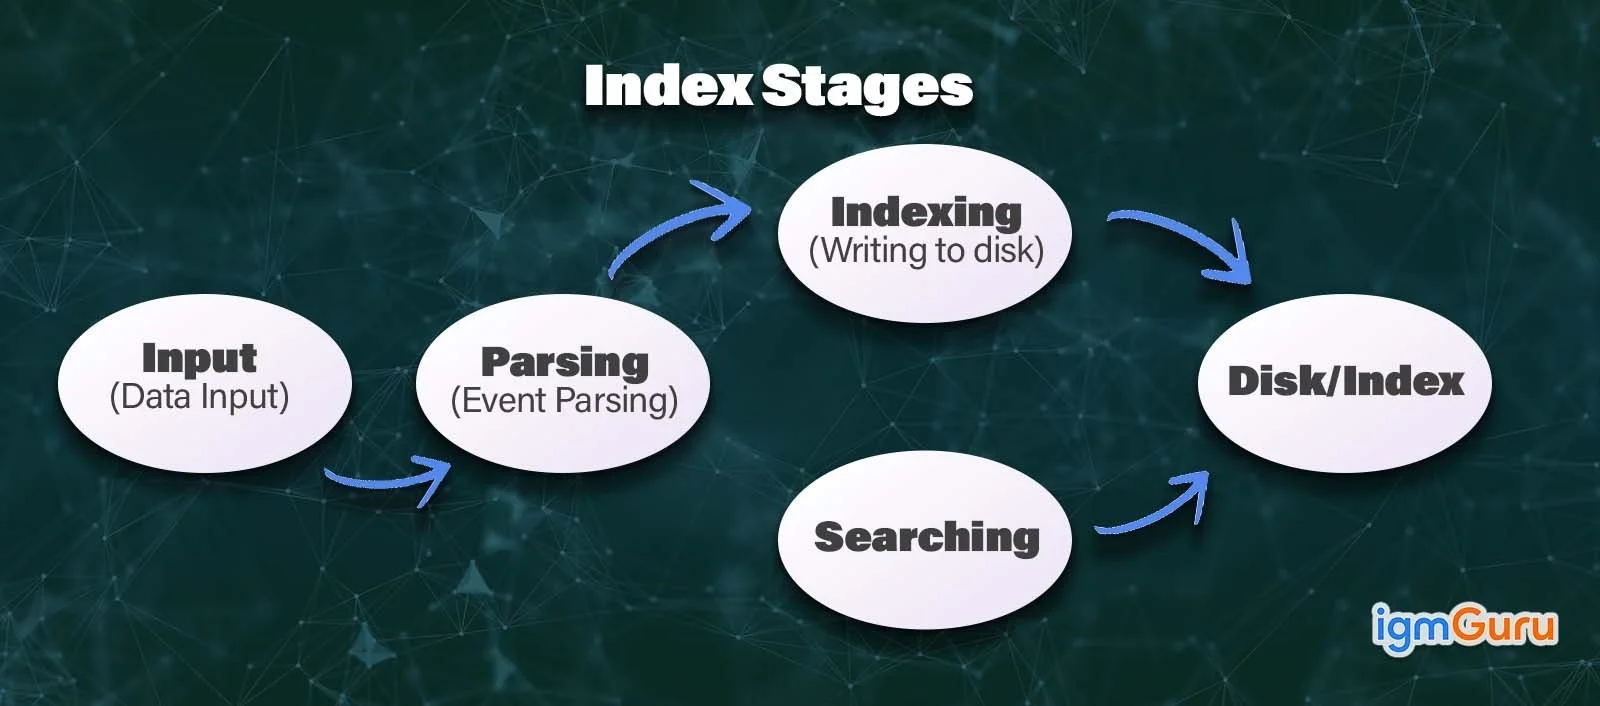
Splunk processes data in three primary steps or stages. These are the data input stage, data storage stage and data searching stage.
A metadata key consists of the source, source type and hostname of the data.
The License Master in Splunk is shouldered with the task of making sure that the limited data is indexed. The amount of data coming on the platform in 24 hours makes the base for each Splunk license. Hence, it is important that the environment is kept within the limits of its purchased volume.
In case the License Master is unreachable, it will become impossible to search the data.
Read Also- How to Become Splunk Expert?
The following are Splunk interview questions for intermediate candidates. These will help you to boost your career and salary prospects. Let's dive in.
Summary indexes are used for storing reports, summaries and analyses computed by Splunk. It acts as a rapid yet inexpensive method of running a query for a long duration of time. If the user does not use a specified one, the default index is used.
Splunk Free lacks a lot of features including -
Splunk DB Connect is a widely used general-purpose SQL database plugin/ extension for Splunk. It permits fluent integration between Splunk reports/ queries and database information. It is used for combining structured data from DBs with unstructured machine data. Splunk Enterprise is then used for uncovering insights from the combined data.
Splunk UI picks colors by default. However, it is still possible to assign the colors as per our choice and requirements to charts while creating reports. To make it happen, go to the dashboard to edit the panels in it. After modifying the panel settings, choose the color as per requirements.
You can also assign colors with certain codes and commands.
There are three types of dashboards in Splunk.
The following are the commands to start or stop this service -
# Start Splunk service - ./splunk start # Stop Splunk service - ./splunk stop # Restart Splunk service - ./splunk restart |
Here is the commands
# Enable - $SPLUNK_HOME/bin/splunk enable boot-start # Disable - $SPLUNK_HOME/bin/splunk disable boot-start |
If you are looking for Splunk interview questions for experienced professionals, then your search ends here. Let us take you through a few of them -
Here is a table of differences -
| Feature | Search Head Clustering | Search Head Pooling (Older) |
| High Availability | Provides robust high availability through a coordinated cluster. | Limited high availability; less resilient to failures. |
| Scalability | Horizontal scaling by adding more search heads. | Load distribution, but less effective scalability. |
| Configuration Management | Centralized configuration management through a deployer. | Less centralized; configuration management can be more complex. |
| Coordination | "Captain" node coordinates the cluster. | Less coordination among search heads. |
| Modernity | Current, recommended approach. | Older, largely deprecated. |
| Data and app replication | Automatic replication of apps and knowledge objects. | Manual replication |
Field extractor is basically the function and the result comes from extracting event data fields. It includes both default and custom fields. It allows individuals to organize their data so they can see the result they are looking for. Using a Field Extractor involves the following steps -
Distributed Search divides the workload across multiple instances and scales resources to manage humongous data. It involves performing actual searching and data indexing. It spreads queries across many search heads and indexers within a scattered environment. This practice provides many benefits including -
Yes, it is definitely possible to clear search history by deleting the file shown below -
$splunk_home/var/log/splunk/searches.log |
To perform this task, we have to define a regex that matches the necessary event(s) and sends others to NullQueue. Here is an instance of this case that drops everything except events including the string login -
In props.conf -
[source::/var/log/foo] # Transforms must be applied in this order # to make sure events are dropped on the # floor prior to making their way to the # index processor TRANSFORMS-set= setnull,setparsing |
In transforms.conf -
[setnull] REGEX = . DEST_KEY = queue FORMAT = nullQueue [setparsing] REGEX = login DEST_KEY = queue FORMAT = indexQueue |
Developing and deploying a Splunk application includes the following steps -
This requires -
Watch real-time data from the metrics log in -
index="_internal" source="*metrics.log" group="per_sourcetype_thruput" series="" |eval MB=kb/1024 | chart sum(MB) |
Watch everything split by source type -
index="_internal" source="*metrics.log" group="per_sourcetype_thruput" | eval MB=kb/1024 | chart sum(MB) avg(eps) over series |
There might be some instances (troubleshooting data) where we need to use the following URL -
https://yoursplunkhost:8089/services/admin/inputstatus |
You May Also Read- Salesforce Integration Interview Questions
Whether you decide to learn Splunk online via a good institute or choose to watch a Splunk tutorial for a better understanding of the field, you will still need to practice top Splunk admin interview questions. Here are the top ones most frequently asked in an interview.
As data ages, it passes through different buckets. Here is how that happens -
Workflow Actions are used when certain tasks need to be automated once the rules have been assigned and the reports are scheduled and created. These actions come in handy when it comes to retrieving a specific set of data that needs to be sent to other fields.
As data is entered in Splunk, the time zone of the entry made is picked. Splunk takes the time zone defined in the browser to add the time zones. Similarly, the browser picks up the time zone that is set on your computer system. Thus, if you want to find it, you will have to search for a particular event.
Splunk has three types of search modes: fast, Verbose and Smart.
Indexer Clustering distributes indexing load and ensures high availability by replicating data across multiple indexers. To configure, enable clustering in the Splunk Web UI under Settings > Indexer Clustering, designate a Cluster Manager and configure peer nodes (indexers) with replication and search factors. Set the replication factor (e.g., 2 or 3) to define data copies and the search factor to determine searchable copies. Ensure all indexers have identical hardware and network configurations. Monitor cluster status via the Cluster Manager dashboard to verify data replication and searchability.
To reset the admin password in Splunk Enterprise 7.1 or later, log into the server hosting Splunk, navigate to $SPLUNK_HOME/etc and rename the passwd file (e.g., to passwd.bk). Restart Splunk using the command splunk restart. Log in with the default credentials (admin/changeme) and set a new password when prompted. If other users exist, restore their credentials from passwd.bk to the new passwd file before restarting. This ensures minimal disruption.
The Splunk ACS (Admin Config Service) API uses JSON Web Tokens (JWT) for authentication. To manage tokens, send a POST request to the ACS tokens endpoint (e.g., https://<stack>.splunkcloud.com/adminconfig/v2/tokens) with an optional type parameter for ephemeral tokens. Specify the target search head or cluster in the URL. Use the generated token in the Authorization header for subsequent API calls. Ephemeral tokens are ideal for short-term access, like CI/CD pipelines, enhancing security by avoiding persistent credentials.
The Splunk Fishbucket, located at /opt/splunk/var/lib/splunk/fishbucket, tracks file indexing progress using seek pointers and CRCs (cyclic redundancy checks). It records which parts of a file have been indexed to prevent re-indexing duplicates, especially for rotated logs. To troubleshoot duplicates, verify Fishbucket integrity and use searches like index=* | stats count by _raw | where count > 1 to identify duplicates, then adjust input configurations or clear the Fishbucket cautiously if needed.
To optimize Splunk performance, implement indexer clustering for load distribution and high availability. Use Universal Forwarders to preprocess and compress data, reducing network load. Scale indexer hardware (CPU, memory, disk I/O) to handle ingestion spikes. Filter irrelevant data at the source using props.conf and transforms.conf to minimize indexing. Enable data model acceleration and summary indexing for faster searches. Monitor performance with the Splunk on Splunk (SOS) app to identify bottlenecks like high CPU usage or saved search overload.
The recent release of Splunk Enterprise 10 and Splunk Enterprise Security (ES) 8.x has introduced several enhancements focused on performance, security analytics, and user productivity.
Enhanced threat-intelligence processing, TAXII 2 improvements, and detection versioning give security teams more accurate insights and better auditability.
Related Article: How to Become a Data Analyst?
Scenario-based Splunk interview questions are commonly asked in real-world job interviews because they test practical problem-solving skills instead of only theoretical knowledge. These questions help recruiters evaluate how candidates handle troubleshooting, log analysis, performance optimization, security monitoring, and data ingestion challenges in production environments.
First, I would verify whether the source system is generating logs properly. Then, I would check the Universal Forwarder status using the Splunk command line and confirm network connectivity between the forwarder and indexer.
Next, I would inspect the splunkd.log file for errors related to connectivity, permissions, or SSL issues. I would also verify configurations inside inputs.conf and ensure the correct index and source type are configured.
I would begin by identifying expensive searches and checking resource utilization on the search head and indexers. Then, I would optimize SPL queries by reducing wildcard searches, limiting time ranges, and using indexed fields whenever possible. I would also consider enabling summary indexing, report acceleration, or data model acceleration for frequently executed reports. Additionally, I would monitor concurrent searches and review scheduler activity to reduce system load.
I would first search authentication logs across all affected systems using SPL queries and filter events based on failed login attempts, unusual IP addresses, or abnormal login timings. Then, I would create correlation searches to identify patterns such as brute-force attacks or credential misuse. I would also use dashboards and visualizations to analyze trends and generate alerts for suspicious behavior.
I would recommend filtering unnecessary logs before indexing using props.conf and transforms.conf. Reducing noisy or duplicate events can significantly decrease storage usage. I would also implement data retention policies, archive older data to frozen storage, and use summary indexes for historical reporting instead of storing all raw events for long durations.
I would first verify whether the issue is related to delayed indexing, search concurrency limits, or dashboard refresh intervals. Then, I would inspect scheduler activity and check if the underlying searches are timing out. If needed, I would optimize the dashboard queries, reduce unnecessary panels, and switch to real-time search configurations for critical monitoring. I would also monitor indexer performance to ensure data ingestion is functioning correctly.
I would first identify repetitive investigation tasks that consume the most analyst time, such as summarizing alerts, correlating events, and generating investigation notes. Then, I would configure the AI Assistant within Splunk Enterprise Security and ensure it has access only to the required datasets and permissions.
Before deploying it in production, I would validate the AI-generated outputs against real incidents to ensure accuracy. I would also establish a review process where analysts verify recommendations instead of relying on them blindly. This approach improves investigation speed while maintaining security and compliance standards.
I would begin by assessing the existing environment, including indexes, apps, dashboards, forwarders, saved searches, and integrations. After identifying dependencies, I would migrate data sources in phases instead of moving everything at once to reduce business risk.
Next, I would validate data ingestion, user permissions, dashboards, and alerts in the cloud environment before switching production workloads. Once testing is complete, I would monitor system performance closely and optimize configurations to ensure users experience minimal downtime during the migration.
I would first confirm whether the raw events are being indexed correctly. If the data is available but fields are missing, I would inspect the props.conf and transforms.conf configurations to verify field extractions, source types, and parsing rules.
I would also check whether automatic field extraction is working as expected or if custom regular expressions need to be updated because of changes in the application's log format. Finally, I would validate the extracted fields using sample events before deploying the updated configuration across production systems.
I would start by comparing application logs, infrastructure metrics, and traces collected before and after the deployment. This helps determine whether the issue is related to the application code, infrastructure changes, or external dependencies.
Next, I would correlate deployment events with error logs, database response times, and API latency to isolate the affected service. If necessary, I would create temporary dashboards and alerts to monitor the issue in real time until the root cause is identified and the application's performance returns to normal.
There is no end to the amount of knowledge you can intake or the extent to which you can polish your Splunk skills. It all lies in where you complete your Splunk training and how you practice it. The key point to making a career in the tech world revolves around staying ahead of your competition and keeping yourself updated with everything new and trending.
Since Splunk is a widely used software platform to manage and analyze data, it comes as no surprise that the demand for Splunk administrators is so high. With the right Splunk course and with the Splunk Cloud Certified Admin certification, a plethora of opportunities will open their doors for you.
Consider the following areas:
The difficulties of Splunk interviews depend on the role one is going for. Entry-level positions usually expect basic questions on Splunk UI, searching logs and dashboards. For admin or developer roles, you will be tested on architecture, data onboarding, SPL and possibly scripting.
The Splunk Cloud Administrator certification is best for platform administrators, cloud migrators and career builders.
You must be certified with the Splunk Core Certified Power User certification.
This exam is priced at $130 USD per exam attempt. There is also a bundle option for five exams for $500.
The average salary of a Splunk Administrator in India is INR 6.2 LPA. The salary ranges between INR 3.9 LPA - INR 11 LPA. This number can vary based on your location, experience and skills.
The certification code is SPLK-1003.
Yes! Splunk offers a free cloud trial and a developer license for practice. This is a great way to gain hands-on experience before interviews.