Do you Know What is Exploratory Data Analysis?
Learn Exploratory Data Analysis to uncover hidden patterns in your data.

Welcome to the definitive Data Analytics Tutorial! This guide is designed to provide you with a structured learning roadmap, essential skills, and top tools to master the field and make data-driven decisions for any organization.
Data is the world's most valuable resource, driving innovations from personalized streaming recommendations to complex disease forecasting. Data Analytics (DA) is the process of cleaning, transforming, and modeling data to discover useful information, inform conclusions, and support decision-making. Learning this discipline is no longer optional—it’s a prerequisite for business growth.
This comprehensive, beginner-friendly data analytics tutorial is your complete roadmap to understanding what DA is, how it works, and the exact steps you need to take to build a successful career in 2026.
Explore our Power BI training program to get complete knowledge of this business analytics tool.
Before diving into the tools, it's essential to understand the foundation. A strong Data Analyst blends technical ability with critical business acumen.
Your learning journey must focus on mastering these three areas:
A Data Analyst's work follows a systematic process, from defining a problem to presenting a solution. This structured process is critical for producing reliable, actionable insights.
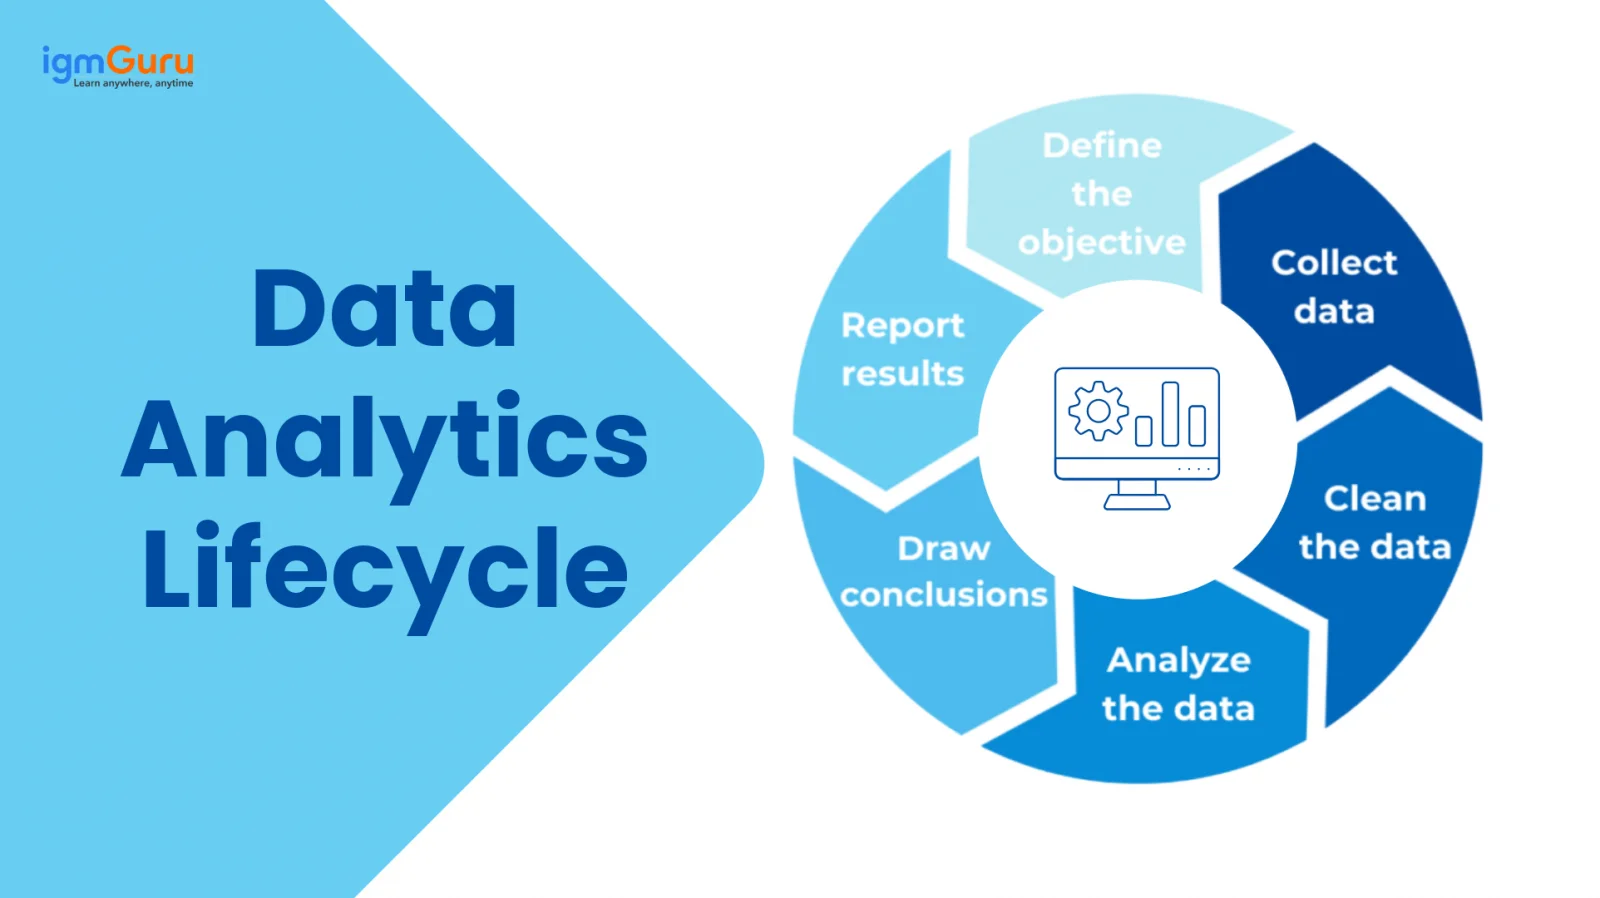
Define the organizational goal and pin the specific business question (e.g., "Why did sales drop by 15% last month in the North region?"). This step ensures your analysis provides value.
Gathering data from various sources (Databases, APIs, Spreadsheets). The data is then subjected to Data Cleaning/Wrangling—rectifying inaccuracies, handling missing values, and standardizing formats to ensure Data Integrity.
Executing Exploratory Data Analysis (EDA) using statistical methods and tools (Python/R). This involves looking for patterns, testing hypotheses, and employing BI and predictive modeling techniques.
Translating the technical findings into business context. This involves using Data Visualization tools to create clear dashboards and charts that showcase the 'story' the data tells.
Presenting the findings and recommendations to stakeholders. The result is interpreted to validate whether it meets expectations and successfully solves the initial business problem. This leads to improved Decision Making.
The major kinds of data analysis build on one another in complexity and purpose, moving from understanding the past to shaping the future. Businesses use these sequentially to extract maximum value.
| Type | Question Answered | Description | Practical Example |
|---|---|---|---|
| I. Descriptive Analysis | What happened? | Summarizes and describes features of historical data (e.g., averages, total counts). Focuses on KPIs. | Calculating Total Revenue and Average Customer Age for the last quarter. |
| II. Diagnostic Analysis | Why did it happen? | Digs deeper into descriptive findings to identify causes, using techniques like drill-down and data mining. | Identifying that the sales drop was caused by a specific component failure (from an abnormal pattern analysis). |
| III. Predictive Analysis | What will happen? | Uses statistical models, machine learning, and historical data to forecast future outcomes and probabilities. | Forecasting next month's customer churn rate or inventory needs using regression analysis. |
| IV. Prescriptive Analysis | What should we do? | The 'final frontier.' Combines insights from all three to recommend the optimal course of action using AI, simulation, and optimization algorithms. | Recommending the optimal pricing strategy to maximize profit, or suggesting the best logistic route in real-time. |
To execute the lifecycle steps, you need proficiency in the right tools. Here are the most valuable tools and skills required by organizations globally, including those in the USA and India.
Read Also - Data Warehousing Tutorial
Data Analytics drives growth and efficiency across every sector. Here's how it's used in high-impact areas:
The demand for skilled analytical professionals is booming. Understanding the career path and potential earnings is a key part of this tutorial.
A Data Analyst is a professional who bridges the gap between raw data and business strategy. They use their technical skills (SQL, Python) and soft skills (communication, presentation) to translate complex data into clear, actionable insights for stakeholders.
| Region | Entry-Level (0-2 Yrs) | Mid-Level (3-5 Yrs) |
|---|---|---|
| USA ?? | $65,000 - $85,000 per year | $85,000 - $115,000+ per year |
| India ?? | ₹4,00,000 - ₹8,00,000 per year | ₹8,00,000 - ₹15,00,000+ per year |
Salaries vary significantly based on city, company size, and specific skill set (e.g., cloud knowledge adds value).
This Data Analytics Tutorial has provided you with the necessary roadmap, defined the essential technical stack, and outlined the value chain of DA. The scope for growth in this field is immense. Your next step should be to choose one programming language (SQL first, then Python) and one visualization tool (Power BI or Tableau) and work through practical, hands-on projects.
Absolutely. Anyone with an interest in numbers, problem-solving, and a commitment to learning the core skills (especially SQL, Excel, and one visualization tool) can start a career in data analytics.
The single most important skill is SQL (Structured Query Language). All data lives in databases, and SQL is the universal language used to access, manage, and retrieve that data before any analysis can begin in Python or Tableau.
Data Analytics studies past data to find insights. Data Science uses advanced methods to predict future trends.
You can apply for roles like Data Analyst, Business Analyst, Reporting Analyst or Junior Data Scientist.