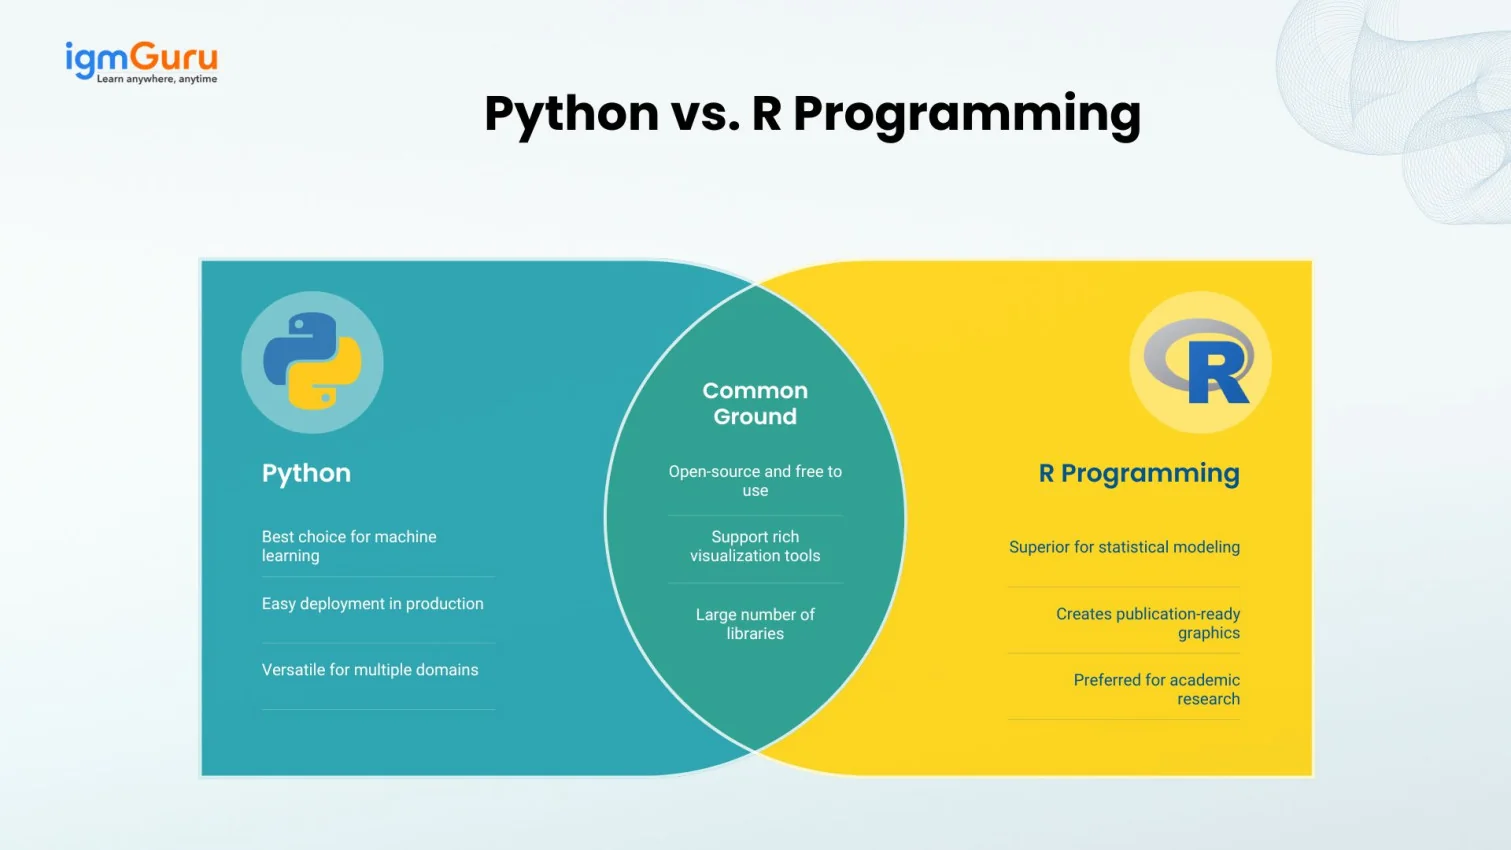
Python and R are two of the most widely used programming languages in data science, analytics, and research. Both handle data exceptionally well, but they serve different purposes and solve different kinds of problems. Python is built for simplicity, automation, and production-level applications. R is built for deep statistical analysis and powerful data visualization.
If you are trying to decide between the two, this Python vs R comparison guide breaks down every major difference so you can choose the right language for your goals. Let's get started.
Python is a highly versatile, general-purpose programming language known for its clean and readable syntax. It is used across multiple domains, including web development, automation, machine learning, and data science. Its ease of learning and rich support of libraries make Python an excellent choice for beginners and professionals who need scalable, production-ready solutions.
R is an open-source programming language designed specifically for statistical computing and visualization. It is widely used in academic research, statistical modeling, and data exploration. Known for its analytical strengths and powerful graphical capabilities, R is especially favored by statisticians, researchers, and data scientists working heavily with statistical models and reports.

Here is a comparison of Python vs R programming languages at a glance:
| Feature | Python | R Programming |
| Primary Purpose | General-purpose programming language used for automation, ML, AI, and web apps | Designed specifically for statistical computing, analytics, and visualization |
| Ease of Learning | Easy syntax, beginner-friendly, English-like structure | Moderate learning curve, best suited for statisticians and analysts |
| Use Cases | Machine learning, deep learning, automation, web development, data engineering | Statistical modeling, exploratory data analysis, and advanced visualization |
| Community Support | Massive global community of developers & engineers | Strong academic and research community |
| Libraries/Packages | NumPy, Pandas, Scikit-learn, TensorFlow, Matplotlib | ggplot2, dplyr, Shiny, tidyverse, caret |
| Performance | Fast with optimized ML frameworks and NumPy backend | Slower for large datasets; optimized for statistical computation |
| Visualization | Good visual libraries (Matplotlib, Seaborn, Plotly) | Excellent visuals (ggplot2, lattice, shiny) |
| Machine Learning | Extensive ML & DL support, industrial production-ready | Suitable for statistical ML models, less support for large-scale ML |
| Data Handling | Handles structured & unstructured data efficiently | Best suited for statistical data & exploratory analysis |
| Integration | Integrates well with web apps, APIs, databases & cloud tools | Best for standalone analysis; not ideal for application integration |
| Jobs & Industry Use | Used in IT, fintech, startups, automation & ML-based industries | Used in pharmaceuticals, biotech, clinical research, academia |
| Environment | Runs on Jupyter, PyCharm, Spyder, VS Code | Runs on RStudio primarily |
| Popularity | Widely popular and most preferred in the industry | Popular in academia and research organizations |
| Scalability | Highly scalable for enterprise & ML production | Limited scalability; fits mathematical & research use cases |
| Best For | ML projects, automation, production-grade systems | Data visualization, statistical reports, research analysis |
Let us take a closer look at Python vs R. There are many grounds on which these two can be compared. While they share a good amount of similarities, here are some of the key differences from the perspective of data science.
Python was designed as a general-purpose programming language, suitable for building applications, automation tools, machine learning systems, and data workflows. Its versatility makes it useful far beyond analytics.
R, on the other hand, was built specifically for statistics and data visualization. It is highly specialized for statistical computing, tests, and graphing, which makes it an excellent tool for research-driven analysis.
Python's clean, easy-to-understand syntax closely resembles English, making it one of the easiest languages for beginners to pick up. It allows smooth progression from simple scripting to advanced machine learning.
R was initially designed for statisticians, so while beginners can perform basic analysis quickly, mastering advanced R tasks may require stronger familiarity with statistical concepts and syntax.
Both languages offer rich ecosystems of packages.
Python's library support spans across domains like machine learning, data analysis, automation, and AI. Popular libraries include NumPy, Pandas, TensorFlow, Scikit-learn, and Matplotlib.
R provides strong statistical and visualization packages. Its most widely used libraries include ggplot2, dplyr, tidyr, Shiny, and caret, making it highly efficient for exploratory data analysis and reporting.
Python is often chosen by software engineers, ML engineers, and data scientists who need production-ready systems and automation. It fits well into large applications where integration and scalability are required.
R is more popular among statisticians, academic researchers, biostatisticians, financial analysts, and professionals who prioritize statistical testing and visual reporting rather than building full applications.
Both languages hold strong popularity within the data science community. However, Python has consistently ranked higher due to its versatility, cross-industry adoption, and strong presence in machine learning and AI domains. R remains highly regarded in academic and research-focused environments.
Python works well with large, complex, and unstructured data formats (JSON, text, CSV, images). It integrates seamlessly into end-to-end data pipelines.
R performs best with structured datasets used for statistical analysis. It is ideal for simulations, experiments, and statistical transformations- but can struggle at scale.
Python offers multiple visualization frameworks but often requires more customization. Tools like Matplotlib, Seaborn and Plotly generate powerful visuals, especially for dashboards.
R delivers visualization as a core strength. Tools like ggplot2 and lattice allow you to build publication-ready graphs with minimal effort.
Python integrates easily with APIs, cloud platforms, databases, web apps, and workflow systems. This enables enterprise-grade deployment.
R is mostly used for standalone analytics or reports. Deploying models from R into production is often less straightforward.
Understanding how each language is actually used in the industry helps you make a smarter choice. Here are some real-world examples.
Both languages have proven their value in professional environments. The industry you work in will often guide your choice more than anything else.
Here are the advantages of Python and R:
| Criteria | Python Advantages | R Advantages |
| Ease of Learning | Clear, readable syntax suitable for beginners | Simple for statistical work; easy to run quick analysis |
| Ecosystem | Rich libraries for ML, AI, automation & data engineering | Extensive packages for statistical modeling & visualization |
| Integration | Works well with web apps, APIs, cloud services & databases | Works well with analytics reporting and research workflows |
| Performance | Fast with optimized frameworks (NumPy, TensorFlow) | Strong performance for statistical calculations |
| Machine Learning | Industry-standard ML/DL frameworks | Good for statistical ML techniques |
| Scalability | Excellent for enterprise-level applications | Great for data exploration and plotting |
| Community | Large developer-focused community | Strong academic & research community |
| Flexibility | Can build systems, dashboards, algorithms, and pipelines | Best suited for detailed statistical studies |
Here are the disadvantages of Python and R.
| Criteria | Python Disadvantages | R Disadvantages |
| Learning | Easy but requires time to master advanced ML workflows | Steeper learning curve when projects become complex |
| Visualization | Requires more customization for high-quality visuals | Limited for production dashboards and interactive apps |
| Statistical Depth | Not as statistically expressive out of the box | Very specialized; not ideal for general-purpose coding |
| Speed for Stats | Slower for certain statistical computations | Can run slow on very large datasets |
| Deployment | Deployment may require additional tools | Deployment in production is challenging |
| Job Focus | More competitive job market crowded with Python users | Fewer roles, mostly niche (research, pharma, finance) |
| Integration | Requires dependencies for advanced tasks | Poor integration with web/cloud & backend systems |
| General Use | Not specifically built for statistics | Not suitable for full-scale application development |
Python is the better choice when you want to build applications, automate tasks, create machine learning models, or work with large datasets. Its beginner-friendly syntax, extensive libraries, and strong integration with web frameworks, cloud platforms, and APIs make it one of the most versatile programming languages for modern development.
| Situation | Choose Python When... |
| Building Applications | You want to develop web applications, desktop software, automation scripts, or production-ready systems. |
| Learning Programming | You're a beginner and prefer a language with clean, readable syntax and plenty of learning resources. |
| Machine Learning & AI | Your goal is to build machine learning, deep learning, or generative AI applications. |
| Large Data Processing | You need to work with structured or unstructured datasets at scale. |
| Production Deployment | Your models or applications need to run in production environments. |
| Automation | You want to automate repetitive tasks, workflows, or system administration. |
| Integration | Your project needs to connect with APIs, databases, cloud platforms, or third-party services. |
| Career Goals | You're preparing for roles such as Data Scientist, Machine Learning Engineer, AI Engineer, Software Developer, or Backend Developer. |
R is the right choice when your primary focus is statistics, data analysis, and creating high-quality visualizations. It offers a rich collection of statistical packages and reporting tools, making it especially valuable for researchers, analysts, and professionals who spend most of their time exploring and interpreting data rather than deploying applications.
| Situation | Choose R When... |
| Statistical Analysis | Your work involves advanced statistical testing, regression analysis, or hypothesis testing. |
| Data Visualization | You need detailed, publication-quality charts and visual reports. |
| Academic Research | You're working on research projects, scientific studies, or university coursework. |
| Business Analytics | Your focus is analyzing data and generating reports rather than building software. |
| Statistical Modeling | You frequently create predictive or statistical models using specialized statistical techniques. |
| Industry Focus | You work in healthcare, pharmaceuticals, finance, economics, or academic research. |
| Reporting | You regularly create reproducible reports, dashboards, or research documents. |
| Career Goals | You're pursuing roles such as Data Analyst, Statistician, Biostatistician, Quantitative Analyst, or Research Scientist. |
Yes, you can, as many data professionals do not choose one over the other. They use both, depending on the task.
For example, a data scientist might use Python to build and deploy a machine learning model, and then switch to R to run statistical tests or create detailed visualizations for a research report.
Here are a few ways both languages work together:
If you are working in a research or analytics role, knowing both languages makes you significantly more valuable. You don’t need to master both at once. Start with one, build confidence, and then learn the other as your projects demand it.
Both Python and R can lead to well-paying careers in data science and analytics, but the number of opportunities and salary potential vary depending on the role and industry. Python is used across AI, machine learning, software development, automation, and data engineering, resulting in a broader job market. R is more common in statistics-focused roles, particularly in healthcare, pharmaceuticals, finance, and academic research. The table below provides a general comparison.
| Career Role | Average Salary for Python Experts (Approx) | Average Salary for R Experts (Approx) |
| Data Scientist | $110,000–$150,000/year | $105,000–$145,000/year |
| Machine Learning Engineer | $130,000–$180,000/year | Rarely an R-focused role |
| AI Engineer | $140,000–$190,000/year | Limited demand |
| Data Analyst | $75,000–$110,000/year | $75,000–$105,000/year |
| Statistician | $80,000–$110,000/year | $90,000–$125,000/year |
| Biostatistician | $95,000–$130,000/year | $100,000–$135,000/year |
| Quantitative Analyst | $120,000–$170,000/year | $115,000–$165,000/year |
| Job Availability | Very High | Moderate |
If you want a quick overview of the syntax and commonly used features, this Python vs R cheat sheet highlights how similar tasks are performed in both languages. It is especially useful for beginners who are learning one language after already knowing the other.
| Task | Python | R |
| Variable | x = 10 |
x <- 10 |
| Comment | # This is a comment |
# This is a comment |
| Print Output | print(x) |
print(x) |
| Create List | numbers = [1,2,3] |
numbers <- c(1,2,3) |
| Read CSV | pd.read_csv("data.csv") |
read.csv("data.csv") |
| Create Function | def add(a,b): |
add <- function(a,b) |
| For Loop | for i in range(5) |
for(i in 1:5) |
| Conditional Statement | if x > 5: |
if(x > 5) |
| Machine Learning Library | Scikit-learn | caret |
| Visualization Library | Matplotlib, Plotly | ggplot2 |
| IDE | VS Code, PyCharm, Jupyter Notebook | RStudio |
Overall, Python offers more career opportunities because it is used across multiple industries, including AI, machine learning, cloud computing, automation, and software development. R remains an excellent choice for professionals working in statistics-heavy domains such as research, pharmaceuticals, healthcare, and finance.
Both Python and R are powerful languages, and the right choice depends entirely on what you want to do. Choose Python if you are building machine learning models, working on automation, or stepping into a production-level data science role. It is the most in-demand language across industries today, and it gives you the flexibility to grow into AI, web development, and data engineering.
Choose R if your work revolves around statistics, academic research, or detailed data visualization. It is the go-to language for statisticians, researchers, and analysts who need publication-ready outputs and deep statistical control.
If you are just starting out, Python is generally the better first language because of its simpler syntax and wider job market. But if your career is focused on research or statistical modeling, R will serve you better.
Definitely, as Python's syntax is more user-friendly (like English) than R's (which is harder to read and requires you to have a good grasp of statistics).
Python is best for ML and DL (deep learning). Python has a number of established libraries (such as Scikit-learn, TensorFlow, and PyTorch), which are often used in ML production environments.
R continues to be relevant and valuable to data scientists. R is often the preferred programming language for performing statistical models, creating complex visualizations, and conducting academic research. R is still widely used in the pharmaceutical, clinical research, and financial industries.
Yes, the job market for Python users is broader and more diversified than for R users. For example, positions such as ML Engineer, Data Scientist, and AI Developer typically require programming experience using the Python language. In contrast, people programming using R are often typecast into more specific work environments (such as research, health care, and academia).
If you are completely new to programming, Python is generally the better language to start with. Its simple syntax, extensive documentation, and wide range of applications make it easier to learn and more useful across different career paths. Once you become comfortable with programming concepts, learning R becomes much easier, especially if you plan to specialize in statistics, research, or advanced data analysis. Starting with Python also opens up opportunities in machine learning, artificial intelligence, automation, and software development, making it a practical first choice for most beginners.