Over 9508 companies are using QlikView as a dashboarding tool around the globe. But why is it used globally and how can it benefit you? This QlikView tutorial is especially designed by our well experienced instructors. This gives every answer to your questions and will equip you with enough knowledge of this platform.
It is a robust business intelligence tool that can convert raw data into meaningful insights. These insights are later used to make valuable decisions and forecast the upcoming trends for businesses. It works just like a human brain and goes in every direction to find a proper solution. But this is not it. Let's dive deeper into its concepts starting with an introduction to QlikView tutorial.
Our QlikView tutorial is curated for both fresher and experienced individuals. It gives all the information from downloading and installation of this tool to its basic and advanced topics. The article further discusses the difference between QlikView and Power BI to find out which one is a better BI tool. It also entails the career path and salary of these experts. Let's start.
Enroll in igmGuru's QlikView Online Course to gain high-level expertise in this BI tool.
The first question that might come to your mind is 'why should you learn QlikView.' Learning this tool can be beneficial in different ways. It is one of the best data analytics and visualization tools these days. This platform has different types of visualization capabilities like reports, charts and dashboards. These visuals are so interactive that anyone with even basic platform knowledge can understand them.
It performs these operations with sheer speed. Many companies are widely using this platform in their data visualization operation. A high demand for qualified experts of this field has emerged due to this wide use. There are more than 4000 jobs available on LinkedIn itself. All of these reasons are enough to get started with QlikView.
Before learning this tool, let's understand how to download and install QlikView. Downloading this platform is an easy process. Here are the steps to download and install this tool –
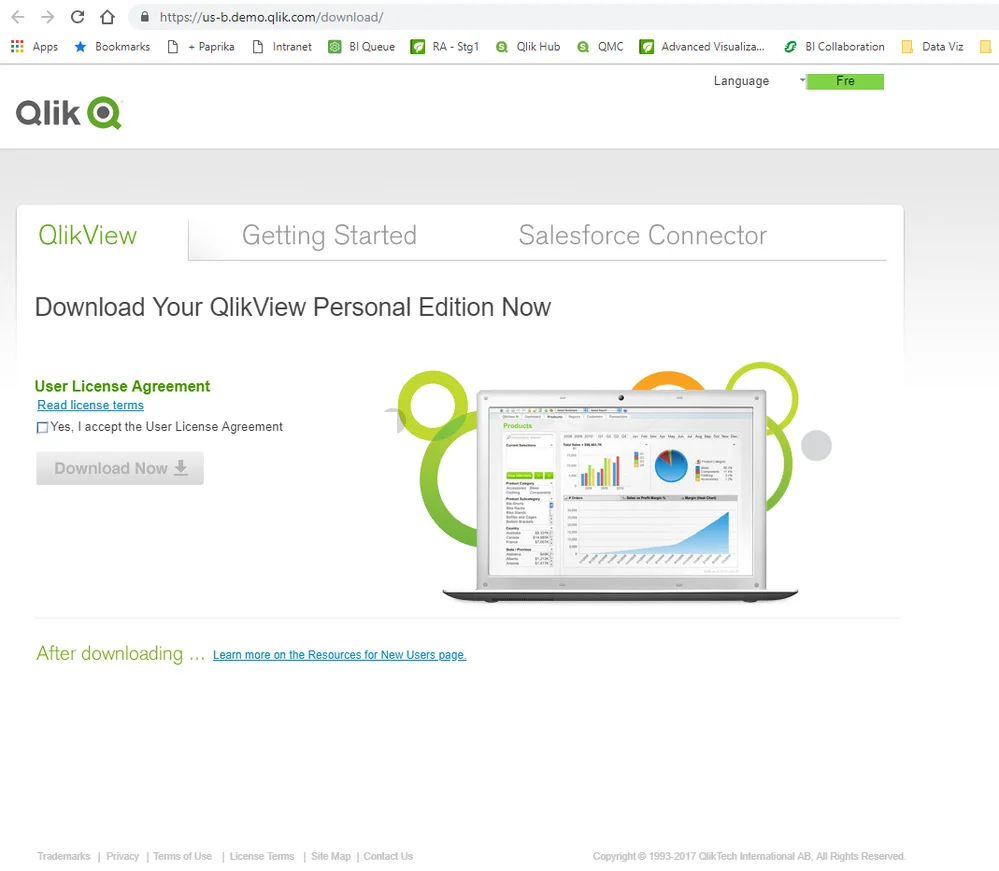
1. First go to the official website and register yourself.
2. Select the Download Now button after registering yourself.
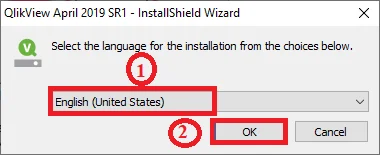
3. A pop-up will show after clicking on the download button. Select your language and click on the Ok button.
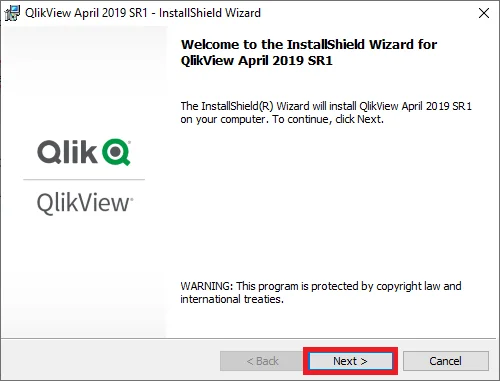
4. It will open an Installation Wizard screen as given below. Now click on the Next button.
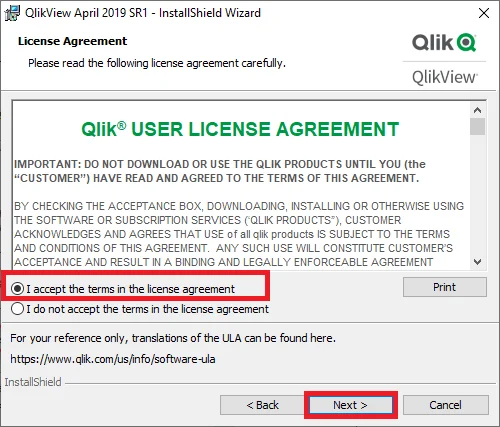
5. It will open a panel with terms and conditions. Read them carefully and click on the Next button.
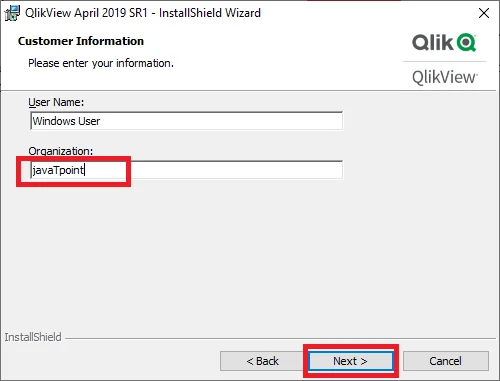
6. Now add User and Organization name as shown below -
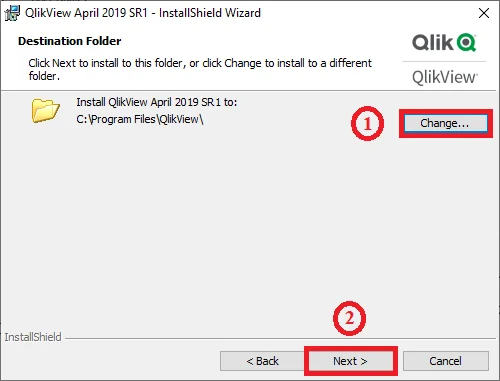
7. Select the target folder where this file will be stored.
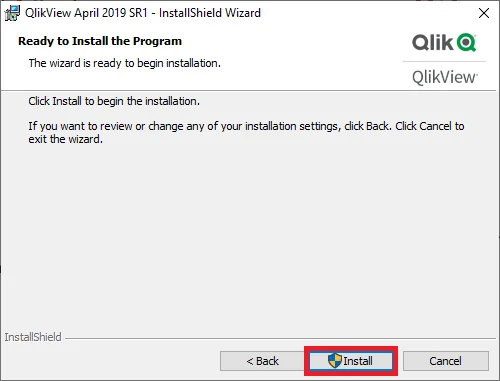
8. Now install this tool in your system.
It is important to go through QlikView architecture before learning how it works. You will understand how data is accessed and shared within this platform by understanding its architecture. The overall architecture of this BI tool is segregated into three different layers.
This platform has different types of applications, web-based programs and software components. All these elements are stored in the front end layer. These elements interact with information and documents existing on this platform. The front end layer is responsible for giving report access to users. It also has a drag and drop function for connecting with live data stores.
The back end layer consists of the QlikView Publisher and QlikView Developer. It is also known as the application platform. All the documents and other files are saved here in different formats. The application platform gives users the access to these files. Individuals can share these files with QlikView Publisher.
Data source end layer is responsible for giving data access to the user. This layer is further used for performing the ETL operations. This is why it is the fundamental layer of this platform. Data source end layer fetches the data from different types of data sources like Excel spreadsheets, Oracle, SAC, etc.
Explore our most in-demand ERP Certification Courses.
Next in this QlikView tutorial are its five important components. Learning about these is also very important. It gives all the information on which of these should be used for your operations. Let's go through components of QlikView to understand their functions -
It is the primary component of this business intelligence tool. It is basically an integrated development environment for data extraction and transformation. This is a Window-based tool that can transform different types of data models. Here one can create GUI layouts, perform data analytics and build different visualizations. Visualizations are created in the form of sharable reports.
It is a combination of application server and web server. This combination works like a presentation layer between servers and the end user. It is used for hosting, managing and distributing reports, documents, dashboards, and delimited files with proper data security. The server has an in-built memory analytics engine and access points for connecting with different types of data sources and obtaining live feedback.
It is a kind of server side application. It works closely with QlikView Script for performing two key operations -
The management console is responsible for managing all the components of this platform. It has a web-based interface to achieve this task. It is mostly used by administrators to give data access for different documents. QMC is also used for deploying associative models online.
It is a frontend component of this platform. It gives different types of access points in the form of web browsers. These access points extract the information from the server, execute database queries and perform many other operations. These tasks can be performed on different devices like mobile, laptop or a desktop system.
So, what are the applications of QlikView?
This tool is used in different use cases. It has applications among different industries including retail, healthcare, finance, manufacturing, etc. Listed below are some of them -
There are many business intelligence tools available in the market. Power BI is one of the most popular of them. At this point, many individuals wonder which is the better BI tool from QlikView vs Power BI. Here is an comparison matrix between them -
Differences | QlikView | Power BI |
Interface | Technical but powerful | User-friendly interface |
Deployment | On-premises flexibility | Cloud-focused deployment |
Cost | Higher enterprise cost | Affordable pricing plans |
Visualization | Highly customizable visuals | Pre-built & simple visuals |
Data integration | Broad & flexible connections | Extensive but basic |
AI Features | Limited predictive features | AI-driven automation |
Scalability | Enterprise-grade scaling | Suitable for SMBs |
Interested in Power BI? Explore our popular Power BI Training Certification Course Online Now!
This platform is one of the widely used BI tools. Hence there are many QlikView career opportunities available in the industry. These opportunities bring along interesting salaries due to high levels of expertise, increasing demand and constantly changing tech space. Some of them are listed below -
These professionals create apps for business intelligence to analyze and visualize data. They often acquire in-depth technical knowledge of this platform. Developers work while coordinating with clients to understand their requirements and develop apps accordingly. The average salary of these developers is $116,501 per year in the USA and INR 5,00,000 per year in India.
Data analyst is another in demand job opportunity in this field. They are responsible for running different data-based operations like data processing, analysis, visualization, etc. These experts give valuable insights, business predictions and decision making power to enterprises. Their estimated pay scale of these experts is between $90,000 to $118,872 per annum.
BI engineer designs, develops and deploys business intelligence solutions with this platform. They work closely with stakeholders to understand their requirements, and create dashboards and reports according to them. These reports show both the current state and historical data of companies. This gives the opportunity to understand the trends which can benefit business. They earn up to $126,557 per year.
This QlikView tutorial has discussed many aspects of this tool including its architecture, components, usage and implementation. It gives business solutions based on different factors. This functionality has resulted in new job opportunities for experts in this field. So, why wait? Master this platform now to build a career on this platform.
Answer - Completing this tutorial will take a few hours only. The entire learning process might take 180 days to complete.
Answer - Visual Basic programming language is used from the last few years on this platform. It is a macro and scripting language used by the majority of software developers.
Answer - QlikView is an extremely supported and popular tool. It fixes all the defects and security issues with frequent updates. All these efforts prove that it will have an impressive future.
Basic data analysis skills, SQL knowledge and understanding of dashboards and data modeling are helpful for using QlikView.
Qlik is not a dedicated ETL tool but it includes data extraction, transformation and loading features for basic data preparation.
Course Schedule
| Course Name | Batch Type | Details |
| QlikView Training | Every Weekday | View Details |
| QlikView Training | Every Weekend | View Details |