If your profession involves leveraging the power of real-time data to extract meaningful insights, this Tableau tutorial for beginners is the right spot. Tableau as a leading data visualization and business intelligence (BI) platform is empowering organizations to explore, analyze and communicate data insights easily. Its intuitive interface, drag-and-drop functionality and powerful visualization capabilities strengthen its reputation among businesses.
A recent study by The Times of India states that its popularity is expected to soar drastically in upcoming years. Having this skill on your resume will help you achieve great career heights. This blog is a comprehensive beginner's guide specially curated for individuals to learn Tableau from scratch. It starts with a basic introduction and covers an installation guide, key concepts and more.
As we all know, Tableau is the most powerful data analysis and visualization tool. It has become the mainstream for many businesses to scale up their stats. Using this, businesses can easily create actionable data and produce the required data visualization output in a simple manner. In layman terms, it can turn your data into valuable insights that help guide your future actions.
Related Article- What Is Power BI Dashboard
Let's understand the need for data visualization before stepping into the path to learn Tableau. Data visualization transforms complicated data into clear visual insights for everyone to understand. The need to sift through many numbers is eliminated as patterns and trends are all available at a glance.
Implementing data visualization leads to quick and informed decisions. The goal is not just to make data look pretty, but to make it meaningful. Visuals play a big part in communicating ideas more effectively. This is true in the case of presenting to a client or holding a strategy meeting with the team. Visually appealing data keeps the audience engaged.
Related Article- How to Become a Power BI Developer?
It is one of those tools that boasts incredible products. Let's discuss the Tableau product family and understand more about them. Learning about these products is essential for all professionals using this tool.
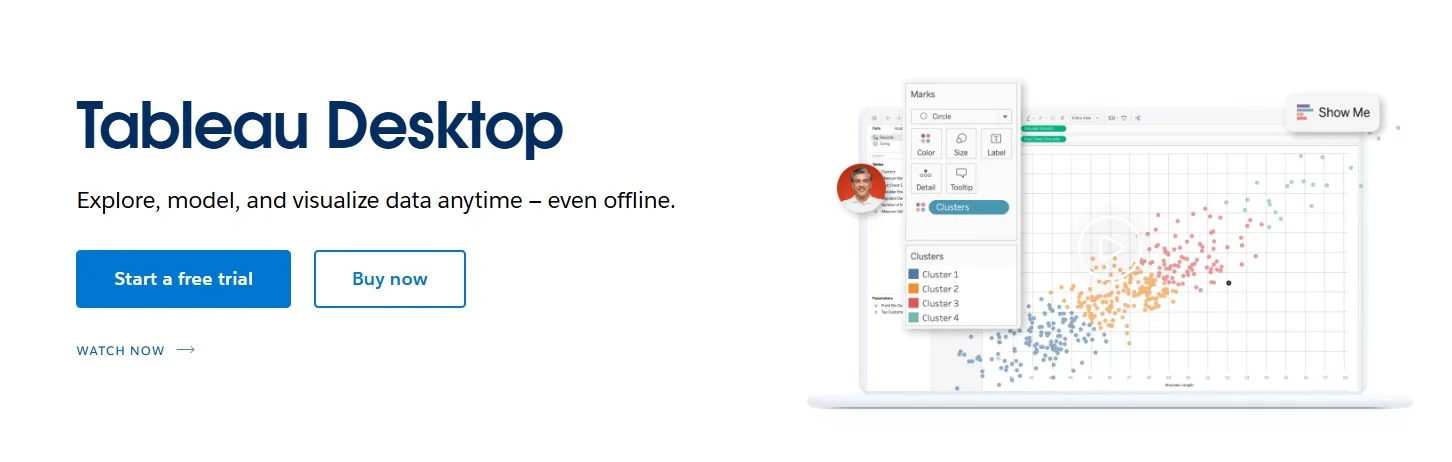
This is a key product that's used in creating and managing visualizations. A rich suite of features is offered to connect with multiple data sources, performing data analysis and building dashboards.
This product is curated for collaboration and allows companies to share as well as manage Tableau workbooks throughout teams. It offers a safe environment for data collaboration and sharing.
It can be called the cloud-based version of Tableau Server and offers the exact same features with the advantage of cloud hosting. It's apt for teams that do not want to be confined to on-premise infrastructure.
It's a free version that's apt for individuals and organizations who wish to share their visualizations publicly. It's mostly used by those who want to build a portfolio or even those who wish to share their insights with a broader audience.
Tableau Prep is crafted to ensure that data preparation is made easier. It's perfect for cleaning, combining and shaping data before analysis so that the data is ready for visualization.
It's a free tool for users to view Tableau visualizations and workbooks. It's perfect for sharing key insights with stakeholders without giving them the access to Tableau Desktop.
Tableau has a variety of products to offer that we have just explored in the above section. Each of these products have their own installation steps. Here we will discuss how to install Tableau Desktop and Public.
Step 1. Check your system requirements:
| Category | Requirement |
| Operating System | Windows 10/11 (64-bit) or macOS 11-14 |
| Processor (CPU) | 1.5 GHz or faster |
| RAM (Memory) | Minimum 4 GB |
| Storage | Minimum of 1.5 GB free disk space |
| Display | 1366 × 768 resolution or higher |
| Architecture | 64-bit system only |
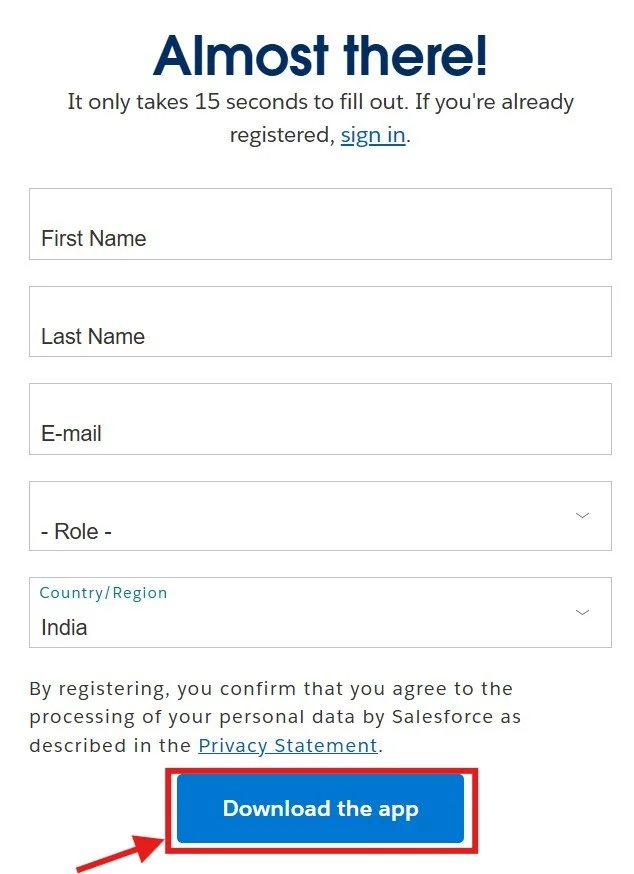
Step 2. Open your browser and visit the official website to download the executable file.
Step 3. Fill in the necessary information and click on the Download the app button.
Step 4. This will download the executable file in .exe format. Navigate to the file under the download section and double-click on it to run this file.
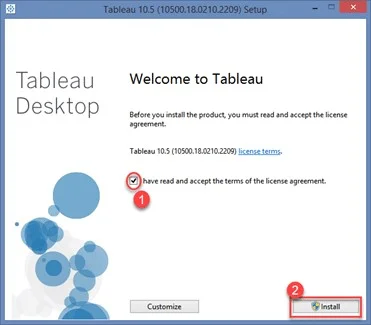
Step 5. Check on both boxes as shown below and click on the Install button.
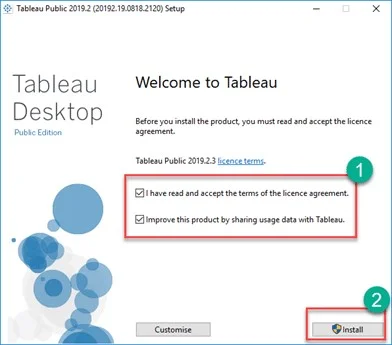
Step 6. Once the installation is complete you can start working on Tableau Public.
Step 1. Check the system requirements:
| Category | Requirement |
| Operating System | Windows 10/11 (64-bit) or macOS 11-14 |
| Processor (CPU) | 2.0 GHz or faster (multi-core recommended) |
| RAM (Memory) | Minimum 8 GB (16 GB or more recommended for large data) |
| Storage | Minimum of 1.5 GB free disk space |
| Display | 1366 × 768 resolution or higher |
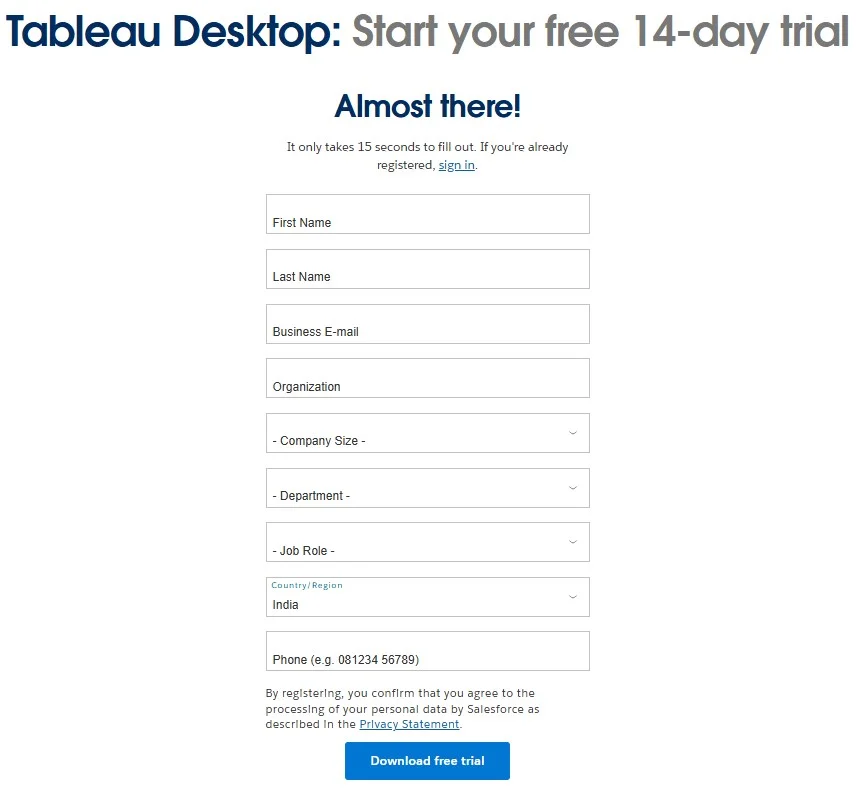
Step 2. Open your browser and visit the official website to download the executable file. While it is a paid version, you can start a Tableau free trial as a beginner.
Step 3. Fill in all the necessary information and click on the Download free trial button. This trial will only accessible for 14 days.
Step 4. Once the downloading process is complete, double click on the executable file, agree with terms and conditions and select the Install button.
Step 5. The system will ask your permission to install the software. Click on the Yes button to continue.
Step 6. Once the installation is complete, open the application, fill in license or credentials details and click on the Start Trial Now button.
After setting up the environment, one must understand the key Tableau concepts. It is essential to get started with this business intelligence platform. Here are the most important concept:
Dimensions and measures are two basic data fields used in data visualization. Mastering these fundamentals helps beginners create efficient visualizations and effective data-driven decisions. Dimensions provide context for analysis by representing qualitative or categorical data like dates, names or categories. Measures are the quantitative or numerical data like quantities or sales used to perform calculations and aggregations.
Worksheets are the fundamental building blocks of visualizations that represent a single view of data with the help of charts and legends. Dashboards combine multiple worksheets into a single page. Stories are a sequence of worksheets or dashboards that tell a narrative. Stories guide the viewer through a specific analysis or story.
Filters, groups and sets are distinct yet related tools used to manage and analyze data. Filters are typically used to show or hide any specific data points based on different conditions. Groups combine multiple dimension members into a single category for simplified analysis. Sets are dynamic subsets of data that can be used as filters or for other calculations.
Aggregations combine different values into a single value to summarize data. Examples include AVG, SUM and COUNT. Calculations build new data using existing data. These create calculated fields to help users in customizing or transforming data.
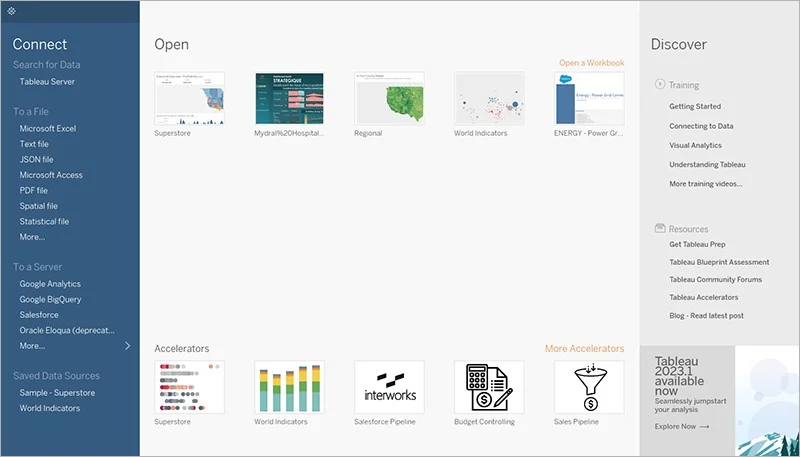
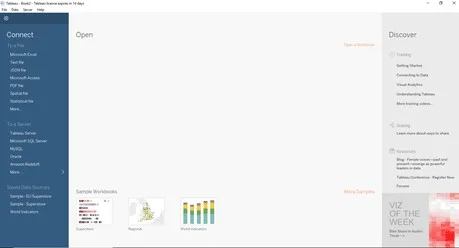
Connecting to a data source is one of the Tableau Server, Google BigQuery, Google Analytics, MySQL, IBM DB2, Oracle database, Hadoop Hive and SAP. Once you connect your dataset, you can perform different types of operations on it like cleansing, aggregation, manipulation, transform, as it is all about working on real-time data. Open the Tableau Desktop and look at its left side. You will find different options to connect a data source from both local and server.
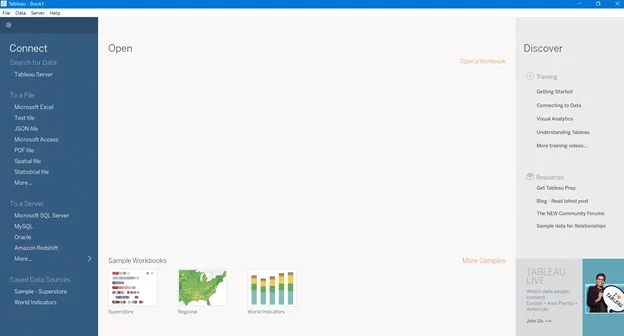
This platform can support various types of local data sources including text, statistical, local databases, Excel spreadsheets and CSV files. For servers, you will have options like Tableau Server, Google BigQuery, Google Analytics, MySQL, IBM DB2, Oracle database, Hadoop Hive and SAP. Once you connect your dataset, you can perform different types of operations on it like cleansing, aggregation, manipulation, transformation, etc.
After successfully integrating your datasources, you will see a Tableau interface showing different features and datasets. This is where you can perform different operations on your data. When your data is ready for the next step, go to the Workbook section from the bottom left corner. Here is an image showing how it looks like:
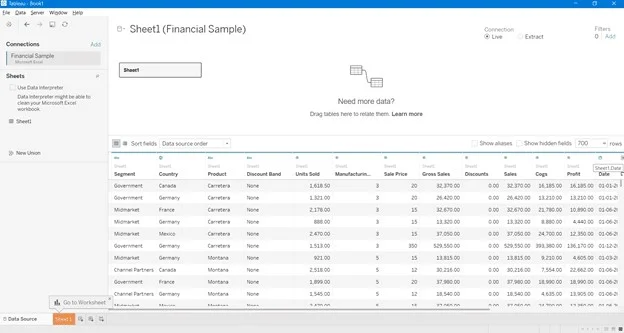
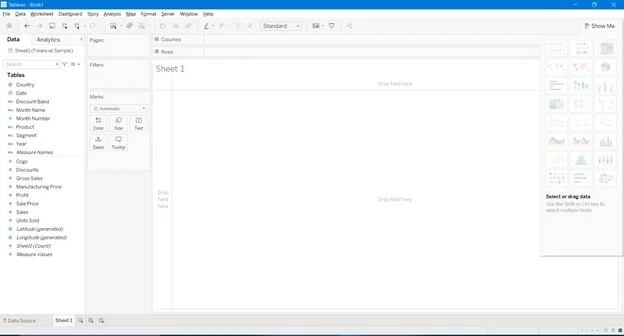
The Workbook section includes various features that help create stunning visualizations of your choice. Here you can see all the variables of your datasets on the left side and their visuals on the right side.
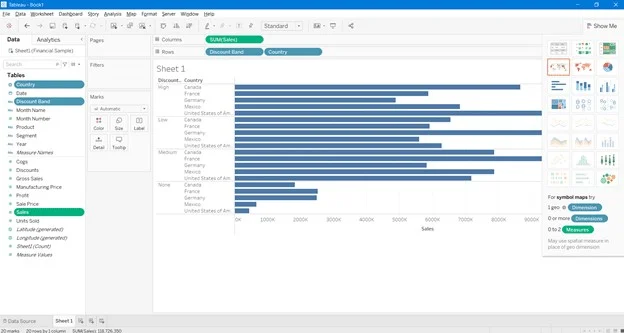
Now, it is time to select data variables to visualize their content. This platform has one more interesting feature here. It highlights the compatible visualization elements on selecting a variable. For instance, on selecting a country’s name it will highlight maps and geographical visuals.
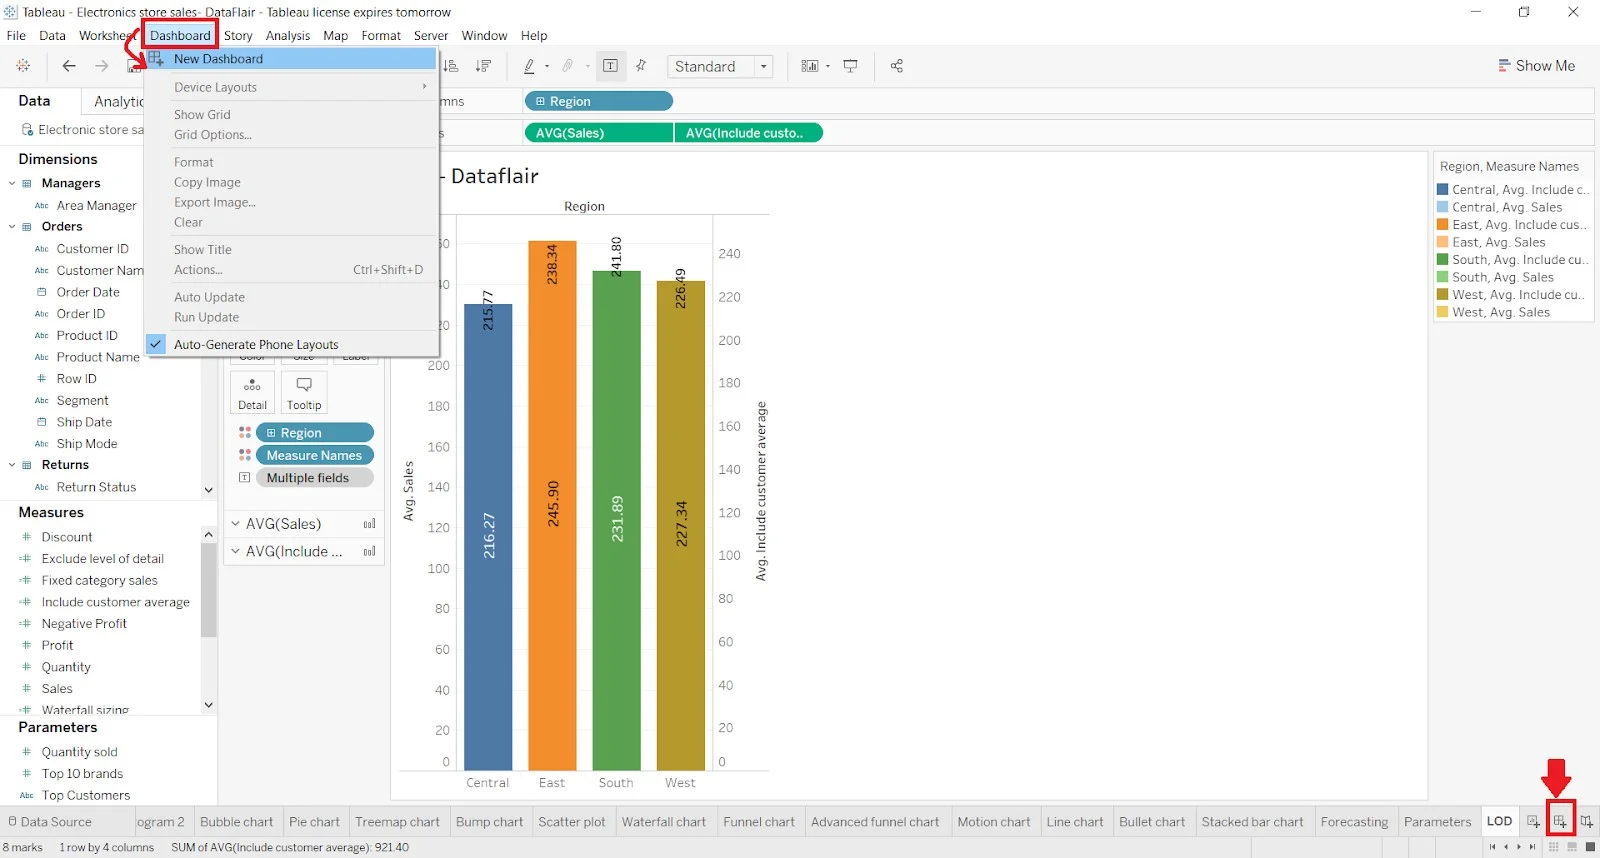
Now that you have learned to create basic visualizations and worksheets, let’s understand how to create a Tableau dashboard. It requires you to combine all the visuals on a single page for better understanding of insights. Creating dashboard on this platform involves multiple step process:
Step 1. Open the Tableau Desktop and click on the New Dashboard option. This will open a new dashboard consisting of all the sheets designed previously.
Step 2. Now, use the drag-and-drop feature to combine all of the visuals you want.
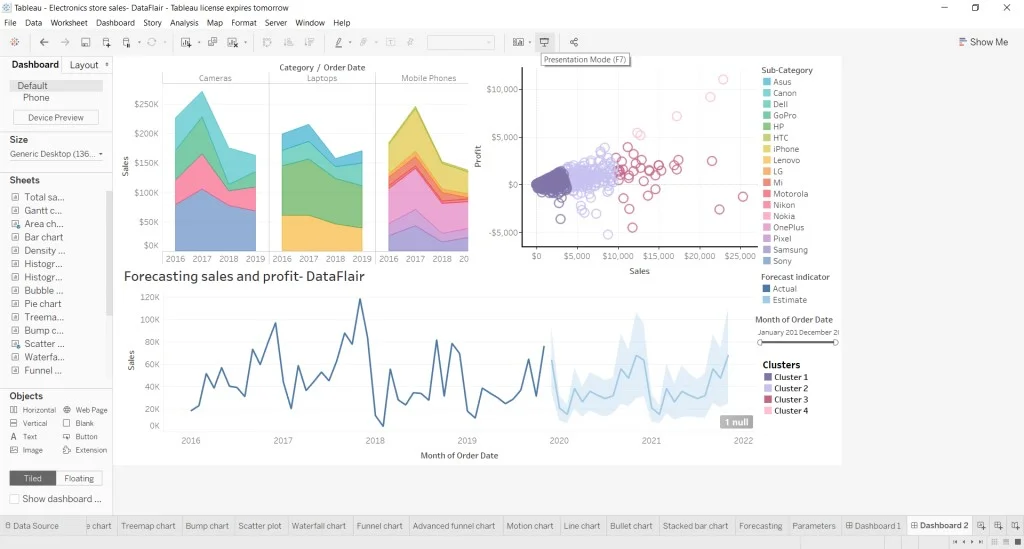
Step 3. Then, start the presentation method by the F7 button on the keyboard to ensure all visualizations are perfectly placed and customized.
This Tableau tutorial is apt for data enthusiasts looking for ways to make data more presentable and understandable. It started with outlining the Tableau definition, importance of data visualization and its products. Finally, the blog moves on to an installation guide as well as different operations to get started with Tableau. All this context is essential for aspirants to become a pro in this tool.
You can explore our latest blog What is Power BI?
Yes, beginners will not find much difficulty in learning Tableau. Of course, expert guidance is necessary to make it happen.
Yes, Tableau is absolutely free to use by anyone, making it an apt choice for everyone.
Ans. A workbook is a kind of container that holds all your visualization, dashboard and stories.
Tableau is mainly used for data analysis, business intelligence and creating visual reports that support better decision-making.
For beginners, basic Tableau skills can be learned in a few weeks with regular practice. Advanced concepts may take a few months to master.
Course Schedule
| Course Name | Batch Type | Details |
| Tableau Training | Every Weekday | View Details |
| Tableau Training | Every Weekend | View Details |