Data plays a crucial role in business development with the capability providing valuable insights, improving decision-making and optimizing operations. Most of the organizations are therefore seeking data science professionals. Are you ready to embrace this career? This data science tutorial for beginners is specially curated to provide a career guide for individuals like you.
It will start from a basic introduction to data science and covers various essential concepts, tools and processes. At the end of this guide, you will be ready to start your career in this field.
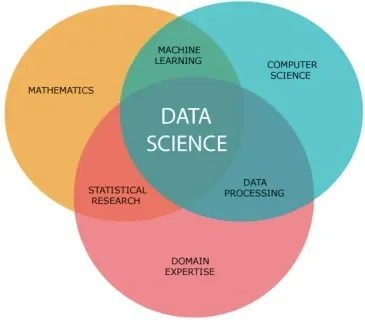
Data science is a wide field that combines scientific methods, mathematics, machine learning algorithms and programming to extract valuable insights from data. It involves various processes including collecting, analyzing and interpreting large amounts of data to uncover hidden patterns and trends. This technology aims to help organizations make better decisions and solve complex problems with the power of data.
Data science is being used in almost every technology. You can see its instances in your daily life like Amazon (product recommendation), Gmail (email filtering) and more. But how? You have to dive into its concepts and terminologies to find out the answer. Let's start from understanding how to set up an environment for data science?
Explore our some of the best Data Science Certification courses.
Setting up an environment is the first step to learn data science. It uses a Python distribution like Miniconda, Anaconda or Python.org. Data scientists mostly prefer the Anaconda distribution due to its impressive package manager known as conda. Consider the following steps for setting up this environment:
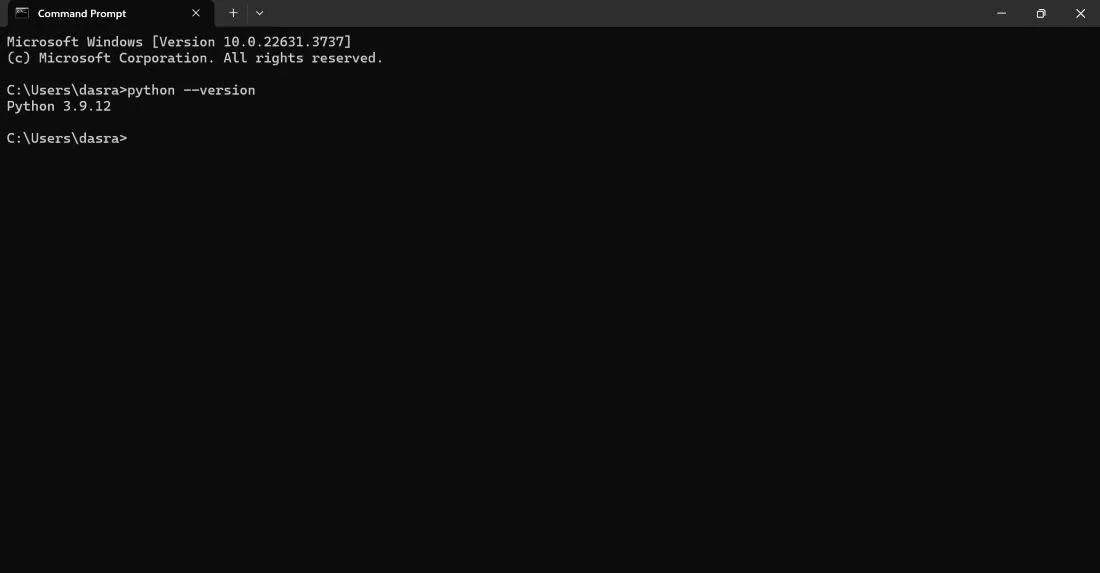
Start with downloading and installing the Python version. Check the version installed in your system with the following command:
python --version
Then download and install the latest Anaconda package. Check the package version with the following command:
conda --version
It is essential to create a virtual environment to perform data science operations. This involves installing essential packages with the help of their respective commands. The commands are:
conda install jupyter
conda install seaborn
conda install numpy
conda install scikit-learn
conda install pandas
conda install matplotlib
conda create --name my_ds_env python=3.x
conda activate my_ds_env
conda install jupyter numpy pandas matplotlib seaborn scikit-learn
Version control plays a crucial role in collaborating projects and tracking changes. Git is one of the popular version control systems to integrate with the Python programming language. Consider the command given below to install Git:
conda install -c conda-forge git
There are many tools used in data science including programming languages, data analysis tools, libraries and more. Some of the most used tools are as follows:
Python is a versatile programming language widely used in data science due to extensive features. Its rich ecosystem of libraries makes it easy to use and helps in handling large datasets. It is particularly well-suited for tasks like data cleaning, preparation, analysis and visualization, as well as developing and deploying machine learning (ML) models. Some common Python libraries are:
R is another best programming language designed for statistical computing and graphics. It boasts a comprehensive collection of packages for statistical modeling, data analysis and visualization. Its strength lies in its ability to perform complex statistical analysis and generate high-quality statistical graphics. This makes it a favorite among data science professionals.
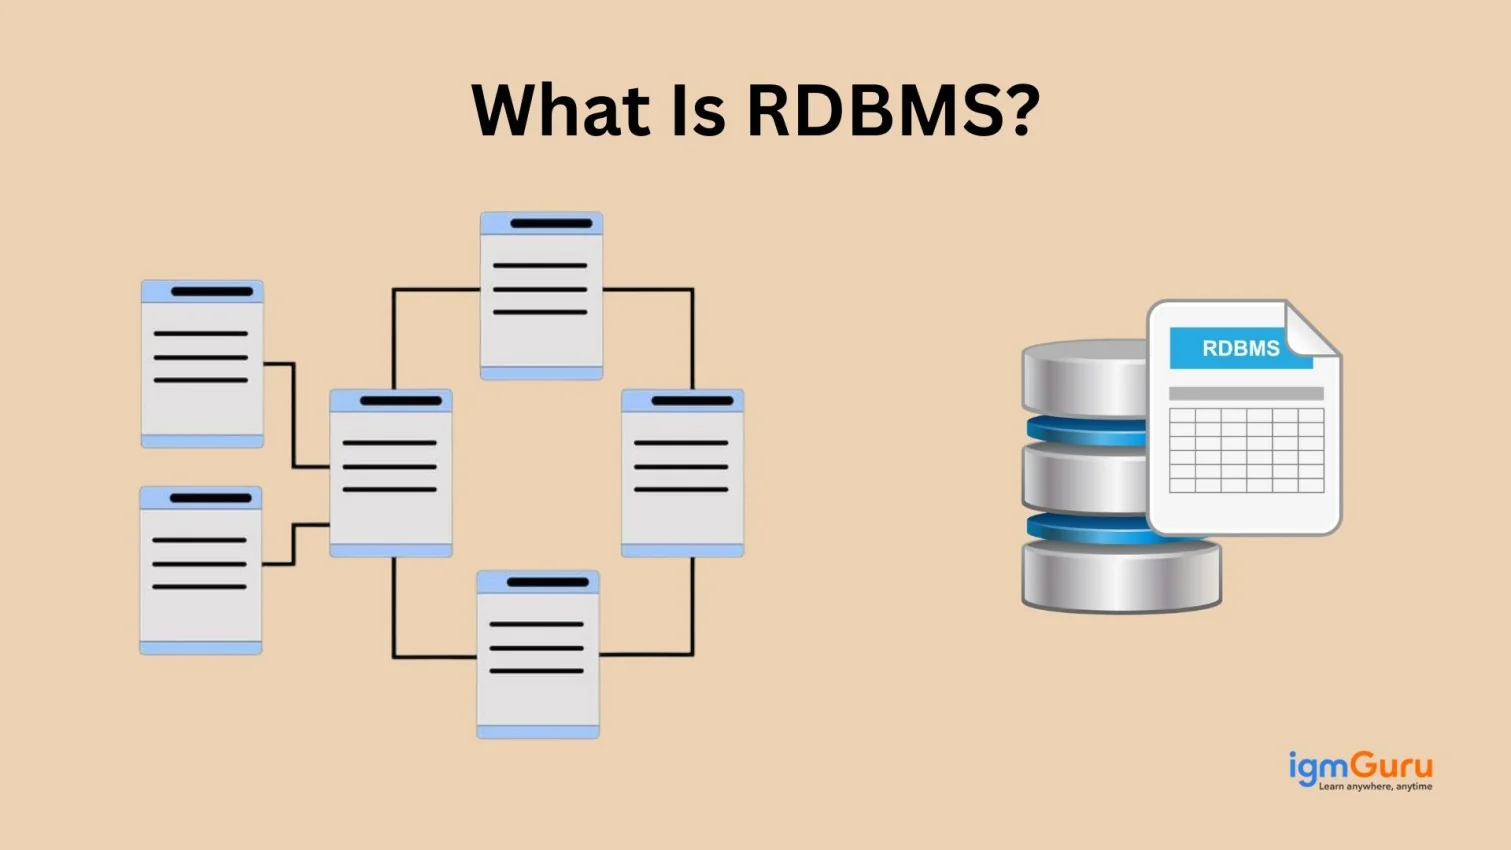
Structured Query Language is essential for managing and querying data stored in relational database management systems. Data scientists frequently use SQL to extract, transform and load data for analysis. Proficiency in SQL helps in accessing and manipulating vast amounts of data with ease.
Jupyter Notebook is a non-proprietary web application that can create and share documents containing live code, equations, visualizations and narrative text. It provides an interactive environment that is widely used by data scientists for exploratory data analysis, prototyping and presenting findings. Its support for multiple programming languages including Python and R, which makes it a versatile tool.
Apart from the programming libraries, data visualization tools also offer interactive and user-friendly interfaces for exploring and presenting data. These tools often provide drag-and-drop functionality and a wide range of chart types. This makes it easier for users to create insightful visuals without extensive coding. Common visualization tools are:
Related Article- Why Data Science Jobs Are In High Demand?
Exploring this technology, you may have wondered how it provides different functionalities. Understanding its basic concepts and operations will help you to find answers:
Data collection is the process of collecting information from different data sources. All this information is then used in the future operations to drive decision making and extract valuable insights. It is crucial to build efficient models. Common methods to perform this process are quantitative and qualitative.
Data cleansing is the method of cleaning inaccurate, unwanted and repetitive information from a given datasets. This improves the reliability and quality of information. It involves using different techniques to identify and correct errors, inconsistencies and inaccuracies in a dataset.
Data analysis is the process of identifying underlying patterns and relationships within data to derive meaningful insights. This supports decision-making and helps to uncover hidden knowledge. It involves using different processes like data examining, data cleaning, data transforming and data modeling to reveal trends and conclusions.
Data visualization is a method to create graphical and interactive representation of information. These visual representations are presented via easy to understand dashboards and reports. It is done by using different data visualization tools.
This technology uses machine learning algorithms to create models for data analysis purposes. The effectiveness of a data scientist's work depends on these models only. This is why model evaluation is essential. It determines how well a trained model performs on unseen data and identifies areas for improvement.
Explore the top Tips to Improve Data Science Strategy for career advancement.
Machine learning is a core component of data science that provides various tools and techniques for data analysis. It also helps to identify patterns and make predictions. It allows computers to learn from data without explicit programming. Data scientists use machine learning algorithms to extract insights, automate tasks and build predictive models.
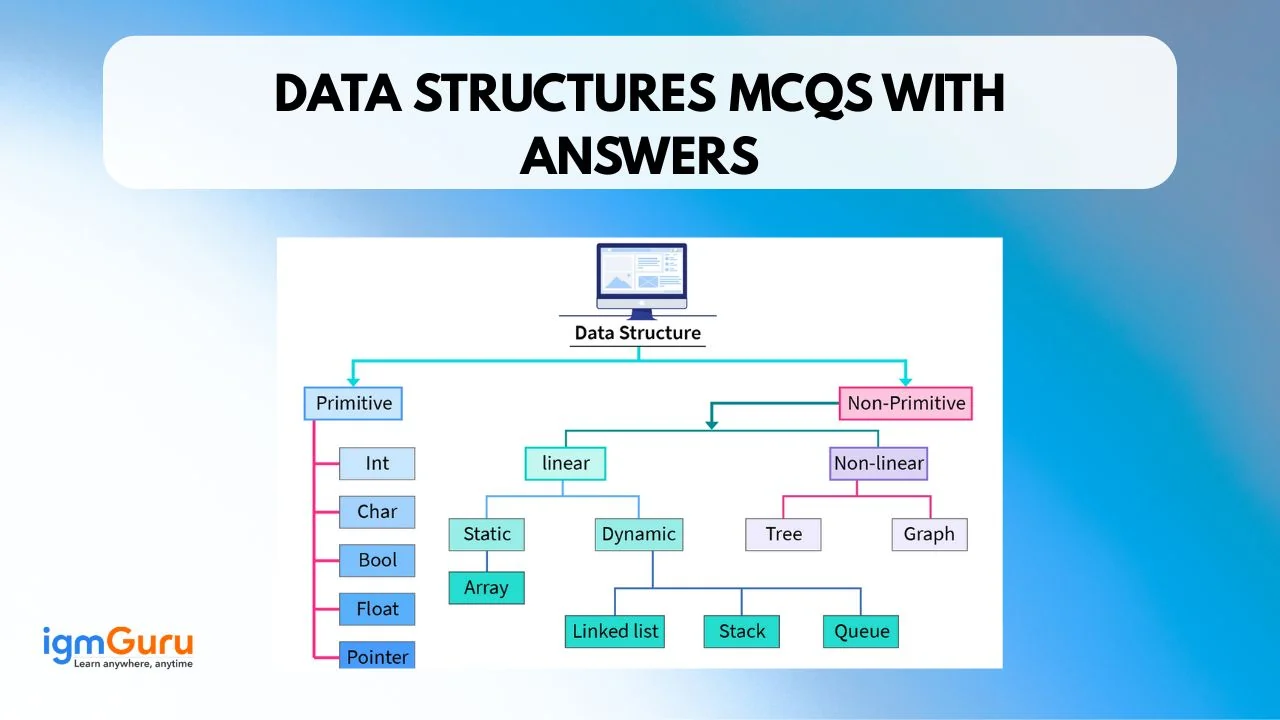
Understanding the data types is also crucial before attempting to analyze it. It helps to understand what method will be best to get the maximum outcome. In data science, we can segregate data into the following three types:
Structured data that follows a predefined, organized format, typically in rows and columns like a spreadsheet or a database table. Each column represents a specific attribute like name, age or city. Whereas, each row represents a single record. It is easier to work with this data using traditional data analysis tools like SQL and spreadsheets. Some common examples are:
Unstructured data lacks a specific predefined structure or organizational model that does not have any neat structure. It definitely holds a vast amount of valuable information but is difficult to extract. Analyzing unstructured data requires more advanced techniques like Natural Language Processing for text or Computer Vision for images. Some common examples are:
Semi-structured data can be defined as the mix of structured and unstructured types. It does not have a rigid structure like relational databases but contains tags or markers. These tags separate semantic elements and establish hierarchies. It offers more flexibility than structured data while still providing some organizational framework. Common examples include JSON and XML files, often used in web applications and APIs.
Exploratory Data Analysis is another crucial operation followed by data scientists. They use it to investigate a dataset and understand its main characteristics. It also helps to detect obvious errors, patterns, anomalous events and relationships between variables. With this technique, experts can produce valid and applicable results catering to their business goals. EDA also benefits stakeholders to explain categorical variables, standard deviations and confidence intervals.
This beginner's guide has explained various concepts, tools and technologies of data science. Starting a career in this field is an exciting journey filled with continuous learning and discovery. The skills and knowledge outlined here provide a solid foundation on which aspiring data scientists can build upon.
As you delve deeper into this dynamic field, use some additional resources like online courses or training programs. The path ahead may involve challenges but will lead you to a rewarding future.
Beginners should start by earning an undergraduate data science degree and then a master's degree in a related field. They should learn about its tools, concepts and gain necessary skills.
Going through a tutorial is helpful because of the different topics it covers. This tutorial for example covers different concepts and technologies used in this field.
Coding is a big part of a data scientist's profile because they are also required to work with programming languages like Python and R.
Data Science helps organizations make data-driven decisions. It improves business strategies, forecasting and problem-solving.
You can learn the basics in 3–6 months, while mastering advanced concepts may take a year or more with practical experience.
Course Schedule
| Course Name | Batch Type | Details |
| Data Science Courses | Every Weekday | View Details |
| Data Science Courses | Every Weekend | View Details |