Business intelligence (BI) is a compound set of technologies and strategies to analyze business data and transform it into highly actionable insights for strategic decisions. Information is everywhere and businesses that unearth information to use it in the best direction move ahead of their competitors. This is what brings companies to use BI in their everyday working.
There's a lot to learn about this data analysis process, its tools, processes and technologies. The global BI market size is projected to touch $63.76 billion by 2032. This is a big jump from $29.42 billion in 2023. The raging advancements can benefit one's career growth graph. Let's learn about what is business intelligence and its other aspects.
Business intelligence is a process that amalgamates data mining, visualization, business analytics, tools and related best practices for decisions backed by strong information. Modern BI comes with a complete view of the company's data and ultimately becomes the reason for change. These solutions give importance to the speed of insights, governed data, powerful business users and flexible self service analysis.
Explore igmGuru's Tableau Training Online to get started in business intelligence.
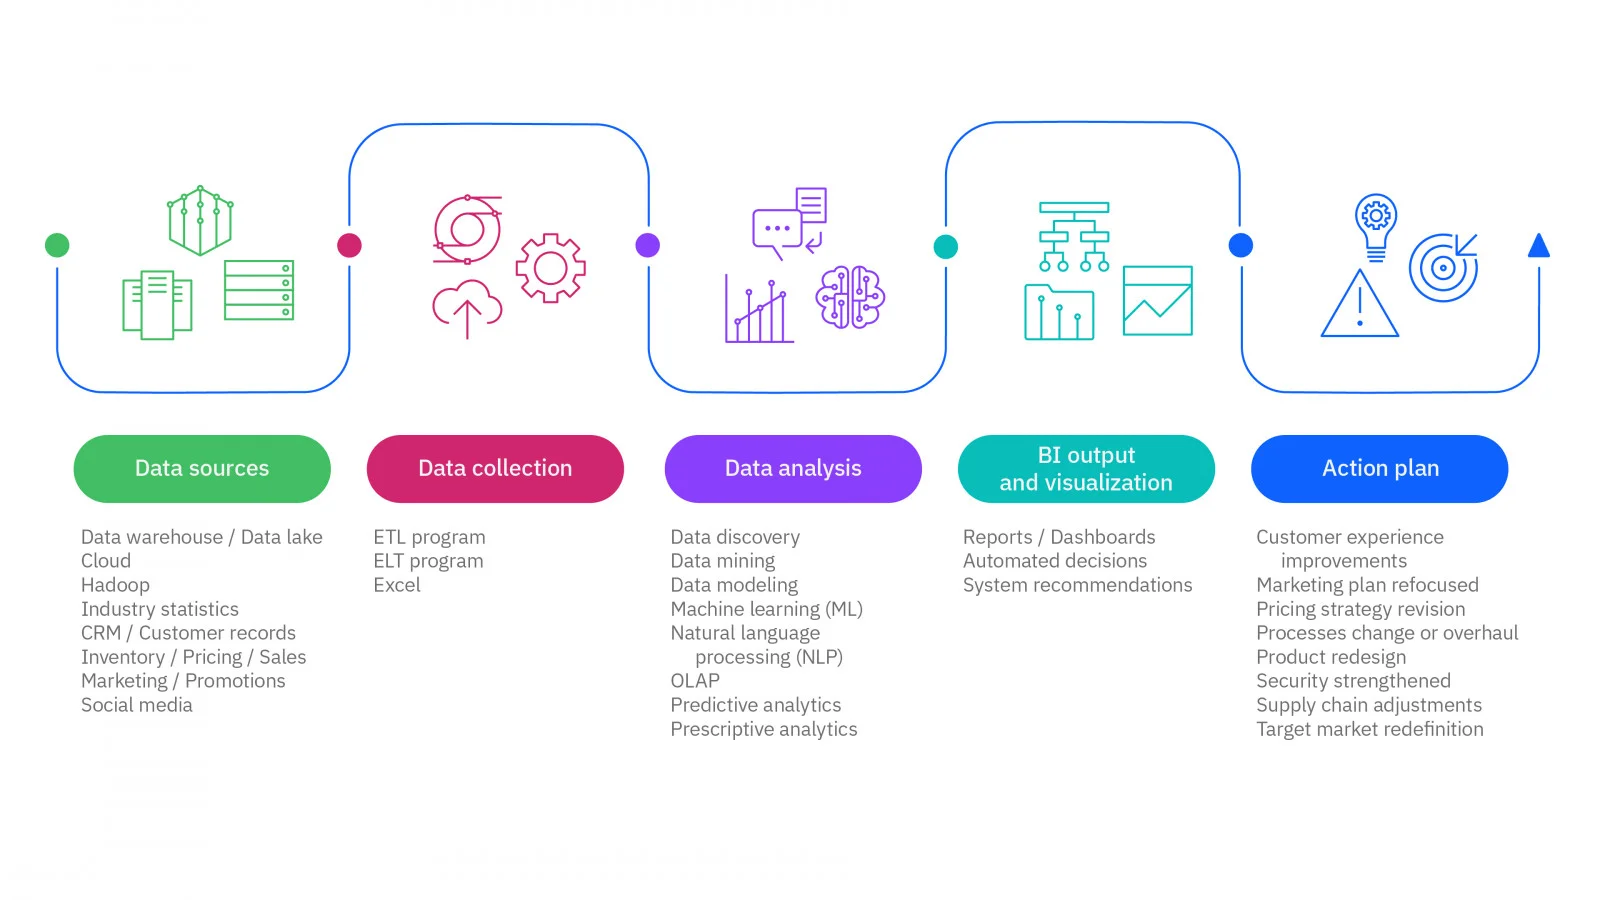
This section covers the four crucial steps that the process of BI encompasses to transform raw information into comprehensive insights for the organization.
The extract, transform and load (ETL)methodology is used by most BI tools to aggregate unstructured and structured info from various sources. It is then transformed and remodeled to be kept in a central location. Here, applications analyze and query the data easily with a single comprehensive set.
Automation is used in data discovery to analyze the accumulated info for any pattern or outliers. These patterns offer valuable insights into the present state of business. Statistical, exploratory, descriptive and predictive are some effective analytics featured by BI tools to explore data, suggest recommendations and foretell trends.
BI reporting makes findings easier to decipher and share with others through visualizations. Engaging and intuitive dashboards, maps, charts and graphs are some prominent reporting methods for users to keep a check of the current happenings in the company.
Companies view the present and past recordings regarding business activities to bring out insights for effective actions. BI allows actual adjustments and planned changes to eliminate inefficiencies, resolve supply and customer issues.
BI is not something precise but rather an umbrella term. It covers different methods and processes for collecting, analyzing and storing info from business activities. There are many different business intelligence methods that make it possible for a company to successfully use their collected information for their good.
There are different types of business intelligence tools , each with their distinct features and capabilities, for gathering, analyzing and presenting data. This then becomes useful for making correct business decisions from the future point of view.
Ad-hoc query tools queries data on the go instantly for quick and easy information exploration and analysis. Crystal Reports and SQL Server Reporting Services (SSRS) are top tools for querying.
Mining tools work with different ML and statistical techniques for uncovering relationships and patterns existing within gigantic sets. These tools identify anomalies and predictive modeling. IBM SPSS Modeler, SAS Enterprise Miner and RapidMiner are leading mining tools.
These tools monitor and manage the company's performance by setting goals, provisioning dashboards and tracking key metrics. Sisense and SAP BusinessObjects are top performance management tools.
Businesses generate insights by exploring data without relying on analysts or IT teams. These capabilities slice and dice information, produce answers to specific questions, perform ad-hoc queries and even create custom reports.
These tools convert raw data into easy to understand visualizations like interactive dashboards, charts and graphs. QlikView, Tableau and Power BI are most often picked tools for reporting and visualizing the findings.
OLAP tools slice and dice details throughout different dimensions for better insights. It leads to advanced analytics like roll-up, pivot, drill-down and other functionalities. IBM Cognos, Oracle Essbase and Microsoft Analysis Services are the best ones out there.
Data warehousing integrates, cleans and consolidates information after extracting, transforming and loading it from different sources. Top examples for such tools are Microsoft SSIS, Oracle Data Integrator and Talend.
Read Also: Best Career Opportunities in Business Intelligence
BI is a lot of things at the same time. It is a process as well as a set of approaches and technologies. The only thing it intends to find is insights and getting an advantageous outcome. This cultural shift takes time and makes it necessary to learn the advantages it brings to the table.
This data-driven approach is a helping hand for fine-tuning launch strategy, boosting campaign performance and driving higher sales. One can also predict future trends or get ahead by anticipating customer needs. There are literally endless possibilities and use cases.
Patients can simply get solutions to their pressing queries without having to go to the staff or medical professions. One can easily track international operations like inventories each minute.
Teams can strategically plan future campaigns and promotions by merging data on sales, promotions, market conditions, pricing, etc. Comprehensive targeting or segmentation can lead to increase in sales.
Organizations can analyze and review statistics to detect latest trends and reveal the causes behind it with descriptive analytics.
Customer service agents can efficiently respond to customer queries or solve their concerns with an unified data source. This source provides product and customer details to agents, enabling them to effectively serve audiences.
Financial enterprises can review market state and customer histories to detect risks, decide the present organization health and foretell future wins.
Enhanced accuracy and easy detection of underlying security issues can be obtained through unified dashboard and centralized data. A single system to collect reporting data simplifies compliance and can streamline regulations.
Businesses that generate data in overwhelming quantities use BI and its subsets for making smarter decisions with it. So there could be some confusion around business intelligence vs business analytics. Here is a deeper look into the distinctive elements.
A common identifier to distinguish between these two is whether it is focused on the present or the future. BI takes historical data into use for understanding and then making decisions around existing business operations. BA takes historical accumulations for predicting the trends and opportunities of the future.
BI tools work well with structured data that is pulled from ERP systems or financial software. BA tools transform unstructured and semi-structured data into structured one for analysis through predictive analytics.
Bigger and older organizations typically use BI tools for managing their gigantic DB. Such companies prefer focusing on their current operations and performance that are better managed with BI tools. Its an important part of the BFSI ( Banking, Financial Services and Insurance) sector. Younger companies prefer BA tools for predicting future trends and opportunities.
BI revolves around descriptive analytics for summarizing historical and current findings. It shows the past and present happenings to answer questions related to 'what' and 'how'. BA revolves around predictive analytics through data modeling, mining and ML. It answers questions around 'why' to determine the possibilities of future outcomes.
BI process needs the expert to have basic math skills with knowledge of using visualization tools. BA process includes data modeling, ML and statistical analysis skills.
Generating reports, tracking sales performance and visualizing insights are some common areas where BI is a reference. BA is more common for optimizing inventory management, forecasting sales and developing marketing strategies.
There is no dearth of BI tools but the most commonly picked ones are Tableau, Power BI, QlikSense and SAP. The same goes for BA but the preferred ones here are Advanced Excel, Python, SAS and R.
Here's a comparison of the Top Business Intelligence (BI) Tools as of 2026, based on features, usability, pricing, and integrations:
| Feature / Tool | Power BI | Tableau | Looker | Qlik Sense | Sisense | Domo |
| Best For | Microsoft ecosystem users | Advanced visualizations | Data modeling & governance | Associative data analysis | Embedded analytics | Business dashboards |
| Ease of Use | Very easy | Very easy | Very easy | Moderate | Fairly easy | Very easy |
| Data Connectivity | Strong (SQL, Excel, Azure) | Very strong (cloud, on-prem) | Excellent (via LookML) | Strong (ETL built-in) | Good (ElastiCube tech) | Great (wide cloud support) |
| Visualization | Good | Excellent | Moderate | Good | Moderate | Good |
| AI/ML Features | Built-in (Azure AI) | Ask Data, Explain Data | Google AI (via BigQuery) | Insight Bot | Some AI support | Native AI tools |
| Customization | Moderate (DAX, Power Query) | High (Calculated fields) | Strong (LookML) | Moderate | Strong | Moderate |
| Collaboration | Microsoft Teams, SharePoint | Slack, Email sharing | Google Workspace integration | Sharing via Qlik Cloud | Embed & share dashboards | Real-time collaboration |
| Pricing | Affordable | Medium | Premium | Medium | Premium | Premium |
| Deployment | Cloud & On-Prem | Cloud & On-Prem | Cloud-first | Hybrid | Cloud-first | Cloud |
| Free Version | Yes | No | No | Limited | No | No |
Completely understanding what is business intelligence might take a while because of the different aspects that surround it. Modern BI and analytics systems will probably integrate AI and machine learning algorithms for getting complicated tasks in line. The rising use of such technologies will also make a huge change in BI because of shared tools and techniques.
Businesses are integrating these technologies in their intelligence processes and tasks. This will certainly make data more driven and outcomes more insightful with better collaboration and sharability. The different steps or models in this process are also affected by this change since their tools are getting smarter and humane.
BI dashboard is a data visualization and analytics tool for quick and user-friendly information. It displays all performance indicators and business metrics on a single screen in a very easily readable manner.
A great example of BI is American Express since this process develops new payment service products for this company. They also retain customers by using it.
Different departments and domains use BI but for the same reasons. Marketing, finance, customer service, sales and operations make the most of it for strategic decisions.
Course Schedule
| Course Name | Batch Type | Details |
| Business Intelligence Courses | Every Weekday | View Details |
| Business Intelligence Courses | Every Weekend | View Details |