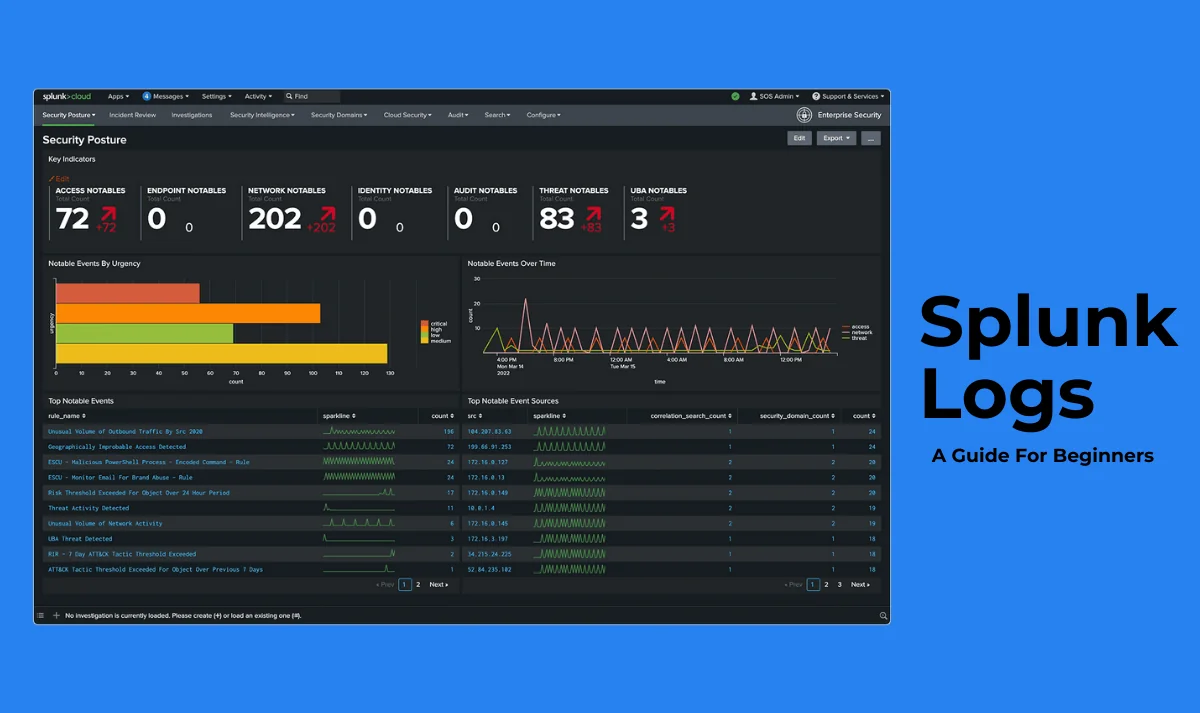
Companies are facing challenges in managing humongous machine data these days. This data is generally locked within log files that hold valuable insights. Extracting these insights from a chaotic sea of logs is a really complicated task. This is where Splunk log comes in. There are a myriad of reasons for using these logs including driving business success, improving security and more.
It unlocks the hidden potential of log data by transforming it into actionable intelligence. This article explores the world of Splunk logs. It involves the introduction, importance, types and working of these logs. This knowledge can be very helpful for both beginners and employed individuals in achieving great Splunk career heights with good salary packages.
Splunk as a platform contains a significant amount of machine data that can be used for many purposes. Splunk logs is a collection of different functions that can implement many operations on this machine data. These operations include search, filter, organize and visualize information from multiple sources. These tasks are performed for troubleshooting issues, monitoring system health and gaining insights into system performance.
It is also referred to as a centralized repository for analyzing logs from different parts of an IT infrastructure. Splunk log analysis can identify trends, patterns and anomalies in machine data. This monitors the performance and health of systems as well as applications. It also detects security threats and compliance issues to resolve problems as soon as possible.

Splunk logs are very beneficial to use as they give a complete record of events and activities within an IT infrastructure. They act like a detailed diary that holds everything from system security status to application performance. This data is invaluable for tracking what is happening across the entire digital ecosystem.
Centralized log management and analysis can improve the value of these logs impressively. This software brings all disparate log files scattered across different systems into a single platform. Experts can search, analyze and visualize the data in powerful ways on this software. This unlocks a diverse range of benefits including -
It has a tool called Splunk Log Observer. Experts use this tool to query logs from the Splunk Cloud Platform and Splunk Enterprise. They can review content from Splunk Observability Cloud by using this tool. For instance, use of parent context logs troubleshoots the nature of applications and their infrastructure.
Another option is to perform codeless queries that identify the root source of system bugs. This will directly show the information from Observability Cloud. Experts can see metrics, traces and related log information to resolve issues quickly.
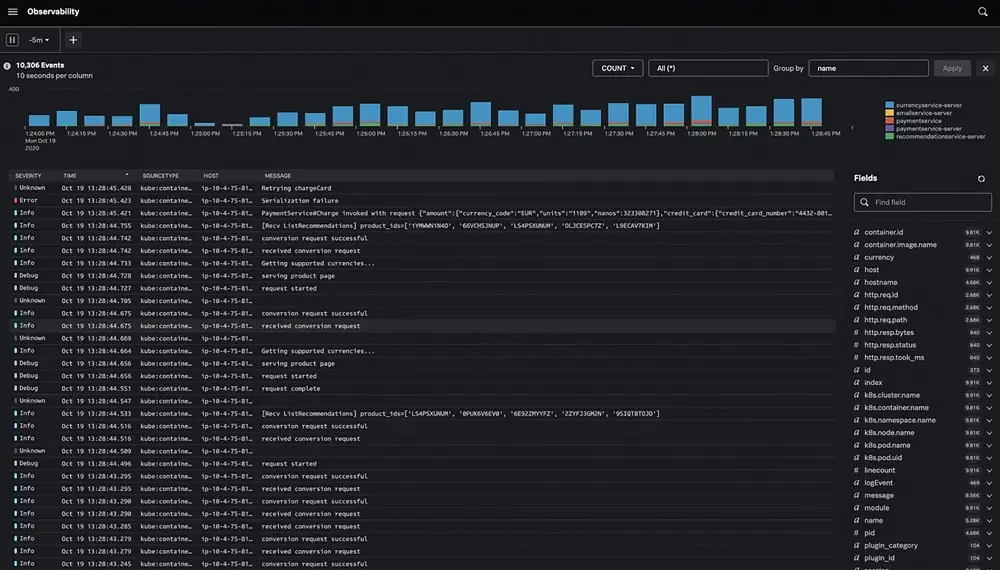
This software has a timeline feature namely Splunk Log Observer. Experts use this feature to see and analyze log data based on a specific time period. They can also identify trends, patterns and anomalies in their log data. This shows the performance of a system over time. Here is an instance that shows all the events is a specific time interval -
This software has log metrics that show the performance of the system. They can measure different performance and operational factors like number of errors, volume of traffic and response time of a system. Search and analysis tools are used to define and calculate these metrics. For instance, the search language can define a matrix to count the number of errors from a given log data.
Related Article- Grafana vs Splunk
Let us explore the types of Splunk logs files to better understand what they are. There is no single count of logs files available on this platform as it depends on the system configuration. It can access and analyse a magnanimous number of logs files due to its integration capability with different data sources. Here are a few of the common data types one should know about -
Access logs contain every request made to a server for capturing details including IP address, timestamp, request method and status code. These logs give a complete and clear view of user activities on a website. This ultimately identifies patterns and anomalies in their activities. It is best for system administrators and security teams.
Common examples of Access logs -
Network logs collect the information of network traffic like IP source, IP address, protocol, port numbers and more. These logs are particularly useful in monitoring network performance, finding potential intrusions and detecting malicious activity. It is best for IT teams to identify unusual traffic patterns, network issues, potential security breaches and troubleshoot connectivity problems.
Common examples of Network logs -
System logs monitor events related to behavior of the operating system. This involves software installations, hardware changes, errors, warnings and system crashes. This gives insights into system health and performance. This log is best for developers and administrators in troubleshooting errors and identifying suspicious activities.
Common examples of System logs -
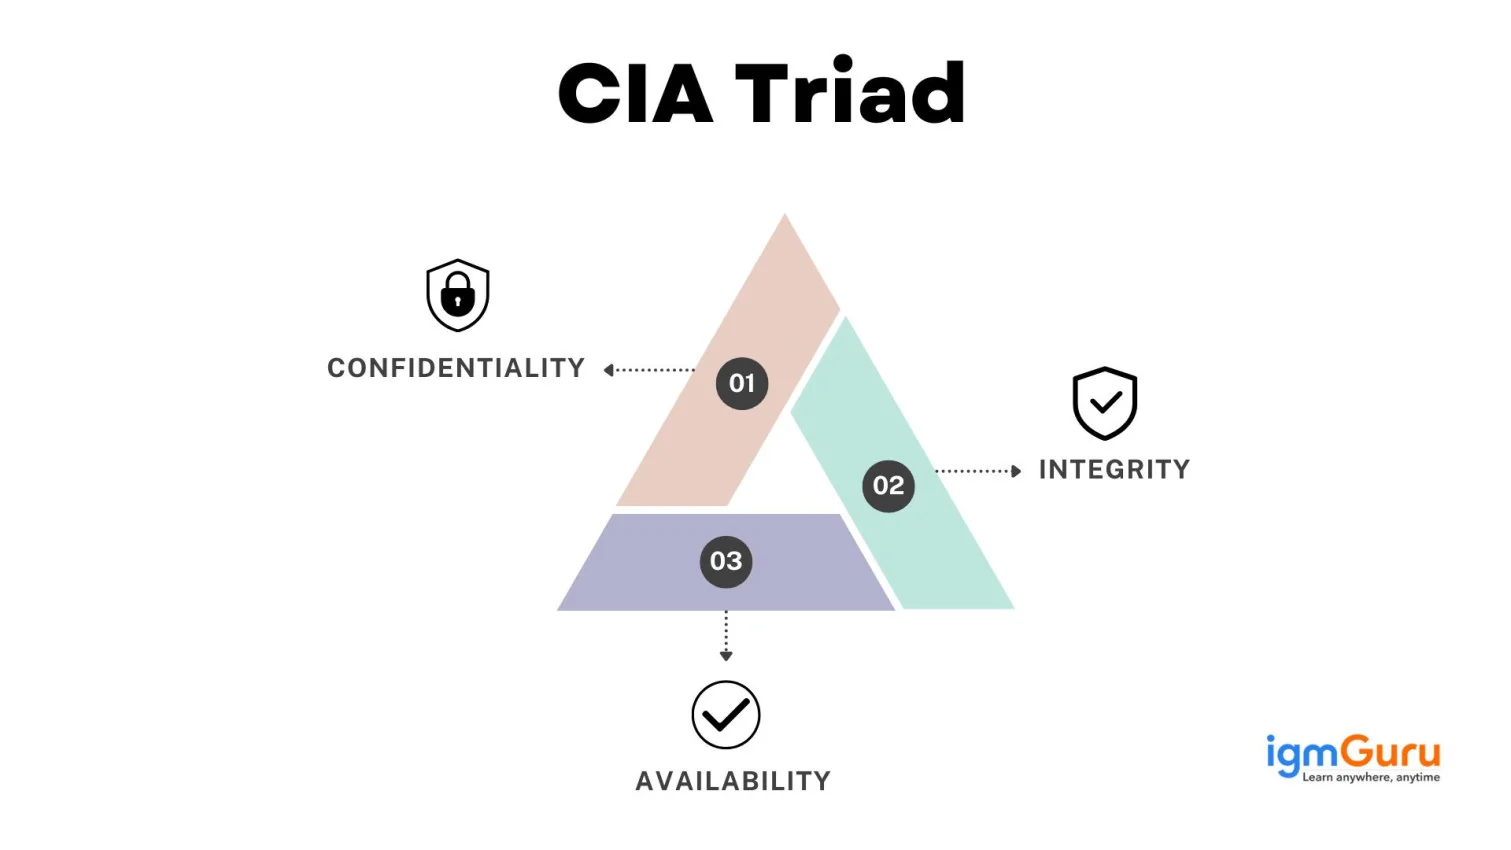
Security logs is a special category of log data that stores information about security events. It can track login attempts, system changes, file access and unauthorized actions. Experts use these insights for detecting potential threats and malicious activities within servers and networks. It also gives a detailed record to easily detect and investigate security breaches.
Common examples of Security Logs -
Audit logs collect and store system activity of the Splunk platform itself. This gives a complete visual of how the system or user works. It includes logins, configurations, searches and more. It tracks all the information from who did what, when and where. These logs are stored in a dedicated index namely _audit by default.
Common examples of Audit Logs -
Database logs contain all the actions performed on a database including building, updating or deleting data. All of them will be stored in a log file. It makes sure that data is consistent and accurate. Logs restore previous data, audit transactions and identify errors. It is best for data and business analysts.
Common examples of Audit Logs -
Application logs are records that track activities, potential issues and user interactions within a software application. This gives valuable insights into the working of applications for troubleshooting and performance monitoring. They are generally created by a software application itself to record its events and errors during operations.
Common examples of Application Logs -
Related Article- Splunk Certifications [Explore Splunk Job Trends And Salary]
The universal path for the location of Splunk logs in different systems is $SPLUNK_HOME/var/log/splunk where $SPLUNK_HOME is different for each system. Here is the table that includes the default location for $SPLUNK_HOME -
| Type of Issue | Operating System | SPLUNK_HOME Default Location |
| Splunk Enterprise | Linux | /opt/splunk |
| Splunk Enterprise | Windows | C:\Program Files\Splunk |
| Splunk Enterprise | Mac | /Applications/Splunk (for .dmg) /opt/splunk (for tar and nix convention) |
| Universal Forwarder | Linux | /opt/splunk/forwarder |
| Universal Forwarder | Windows | C:\Program Files\SplunkUniversalForwarder |
| Universal Forwarder | Mac | /Applications/SpunkForwarder |
| Universal Forwarder | Solaris | /opt/splunkforwarder |
| Universal Forwarder | AIX | /opt/splunkforwarder |
| Universal Forwarder | FreeBSD | /opt/splunkforwarder |

Splunk logs are invaluable resources for web developers and cybersecurity analysts. These give detailed insights into their system activities, user behavior and security threats. Companies can effectively manage their security posture, enhance website performance and give a better user experience using these logs. You will have a basic understanding of Splunk logs after exploring this blog post.
Go to the Log Observer and perform an initial search across all indexes. This will return and access the most recent 150,000 logs. The search function then defaults to Stop for save]ing Splunk Virtual Compute (SVC) resources.
Go to the Splunk web interface and enter a search string. This will show all the events as a list that match the search. Now use Splunk filters to refine results and get the required data.
It is a process of reviewing and analyzing system activity logs captured by the Splunk platform. This gives a detailed record of user actions, system configuration changes and other events. It monitors and investigates potential security issues or compliance concerns within a company.


Advantages And Disadvantages of Artificial Intelligence (AI)
June 25th, 2026