Splunk is a popular data platform for searching, analyzing, monitoring and visualizing machine data (from IoT devices, mobile apps, etc.) in real time. It creates dashboards, visualizations, alerts and graphs by accumulating, correlating and indexing real-time information in a searchable container. This Splunk tutorial will help you learn more about the domain of data analysis, and this leading platform in that space.
IT professionals, IT infrastructure management experts and even students can take the help of this Splunk tutorial for learning essential concepts. There are a few knowledge prerequisites you should fulfill for maximum outcome-
Splunk is a software platform for real time searching, visualizing, analyzing and monitoring of machine-generated data. This information comes from plenty of sources like sensors, web apps and devices. It then carries out correlating, capturing and indexing of live information for actionable insights and informed decision making. It has become a go-to tool for security, business intelligence, IT operations and much more.
With a market share of around 52.63%, it ranks on the top as an operational intelligence platform. Careers in data visualization have gone up drastically, which has led to a rise in the demand for learning this platform as well. It is now seen as the ideal pick for meeting the needs of IT infrastructure by analyzing logs generated in multiple processes. Its in-built features are also its winning points.

Some of the key features that make it such a well-known name are:
The Splunk architecture is composed of three key components.
Its job is to collect live data so that the user can implement live analysis. It collects the entire log's data and sends it to the indexer. There are two main types
Splunk Search Head is a graphical user interface (GUI) that allows the user to perform a plethora of operations as per their requirements. This stage allows easy interaction with the main platform and consequent performance of search and query operations on the entire information.
The Splunk Indexer is employed for indexing and then storing the logs received from the Forwarder. In short, it changes information into events to store and add them to an index. This enhances the overall searchability.
First, the data received is parsed and all unwanted data is removed. The next step is indexing where files are created that are later bifurcated into different directories known as buckets. The files are -
Also Explore: Best Analysis Tools
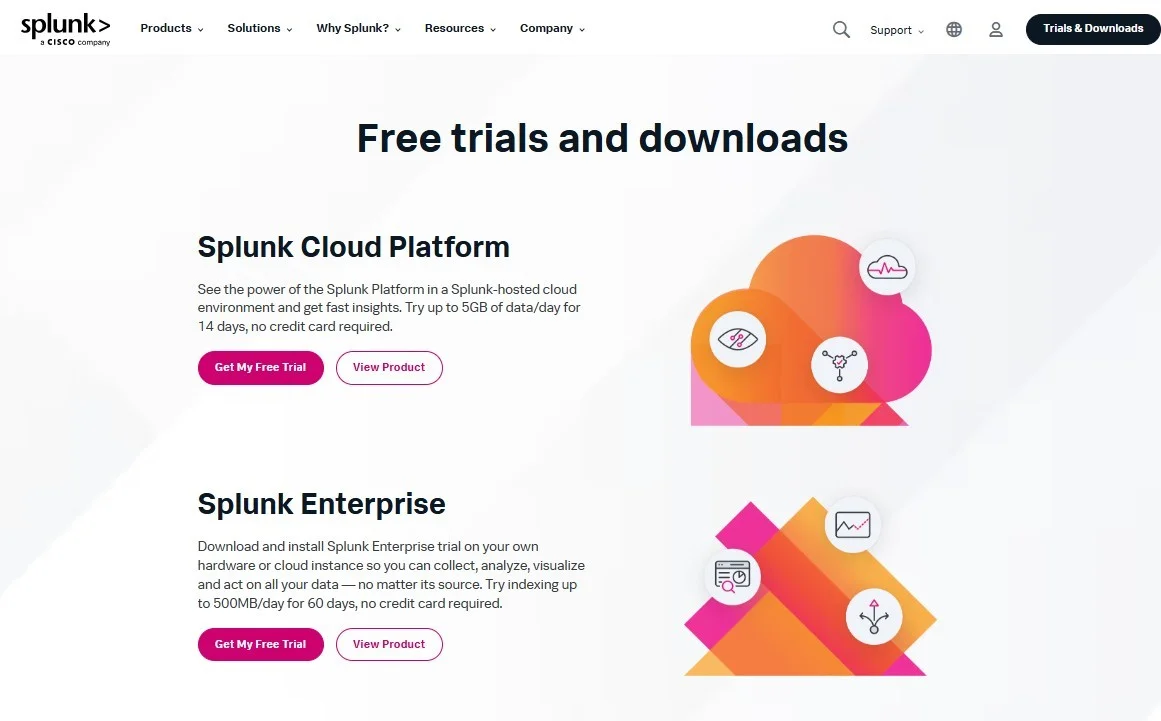
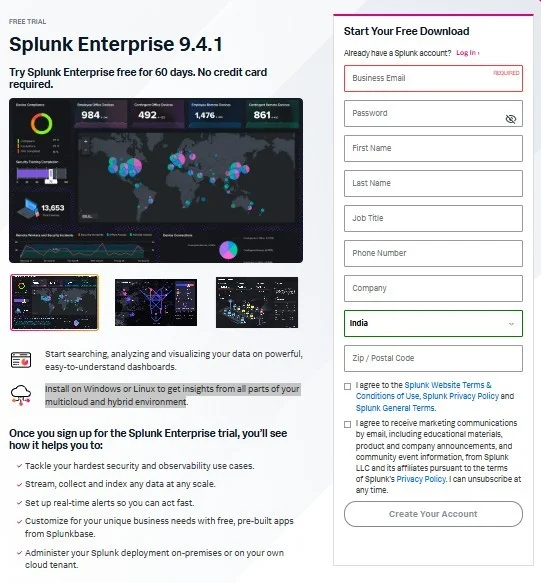
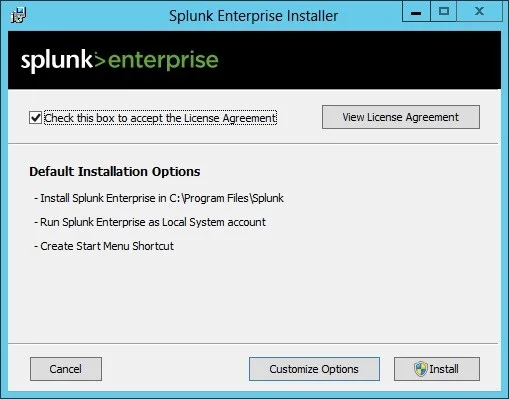
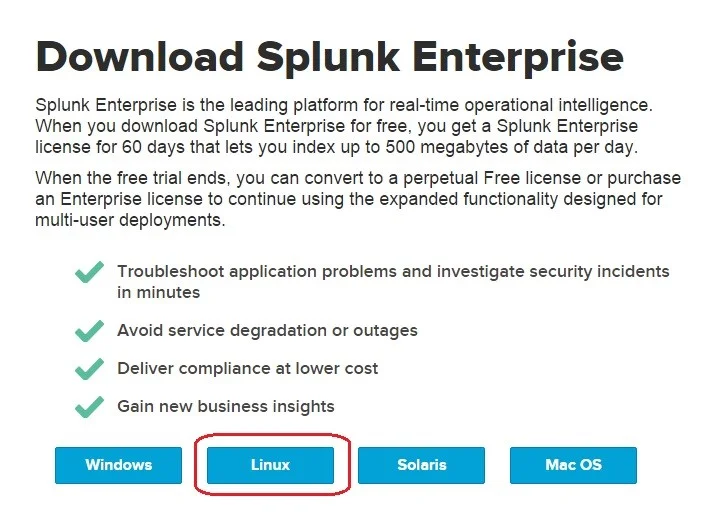
The Splunk Enterprise edition includes a 60-day free trial with full features, allowing you to explore data ingestion, dashboards, alerts, and monitoring. It supports both Windows and Linux environments, making it suitable for organizations of any size. Below is the step-by-step guide to install Splunk Enterprise on each operating system.
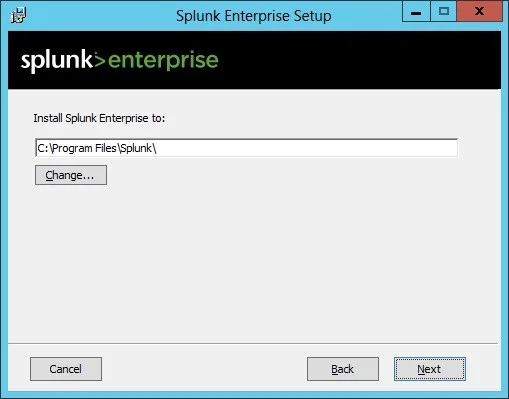
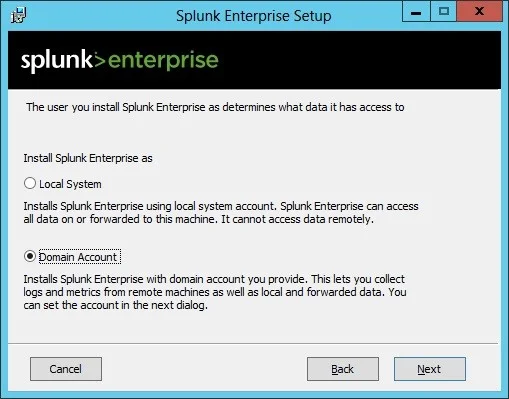
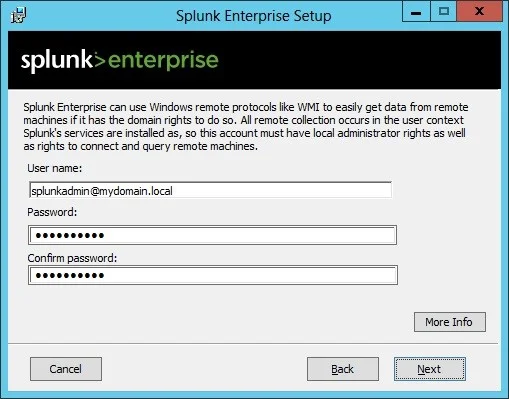
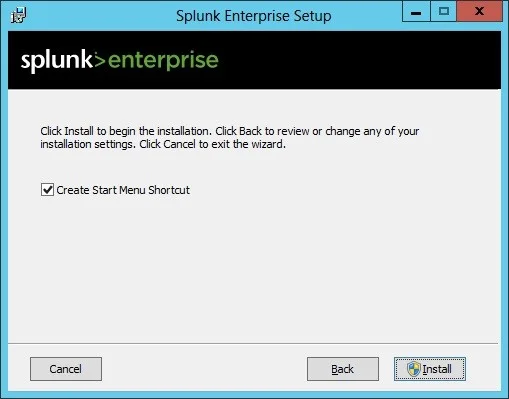
Follow the steps below to install Splunk Enterprise on a Windows machine:
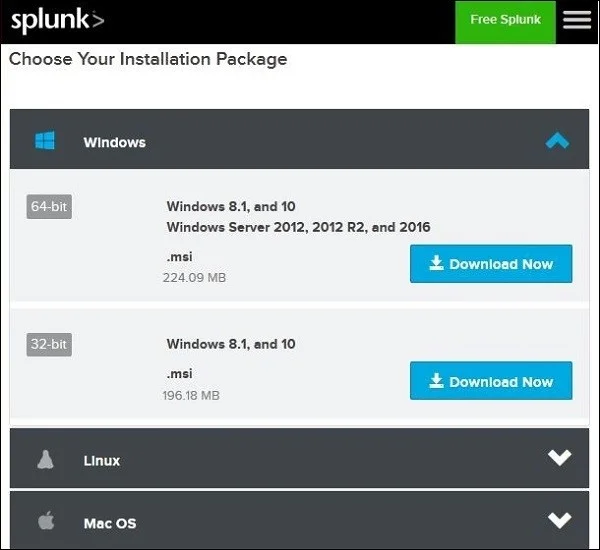
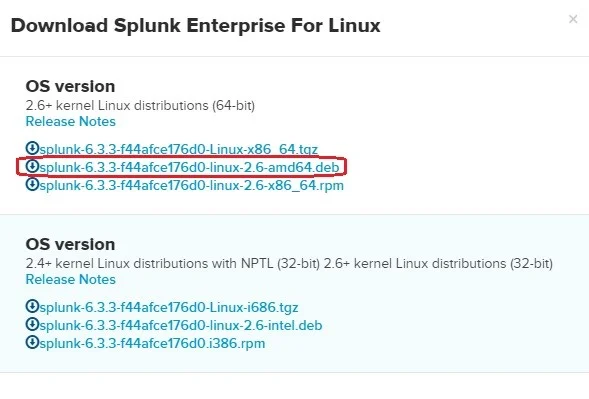
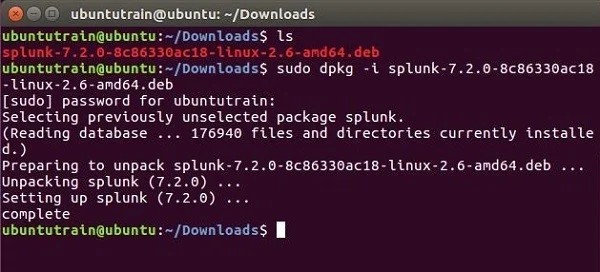
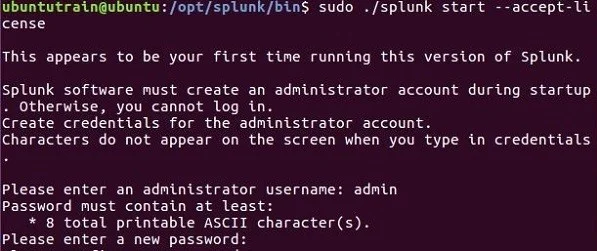
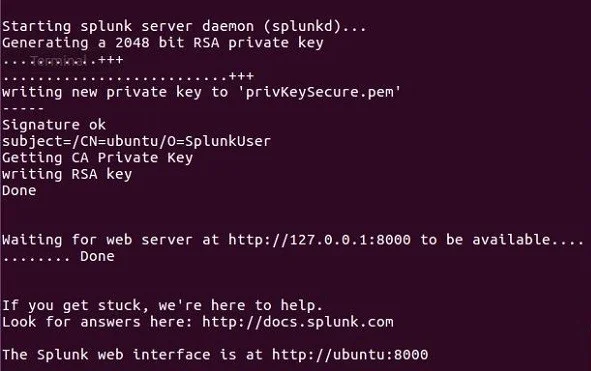
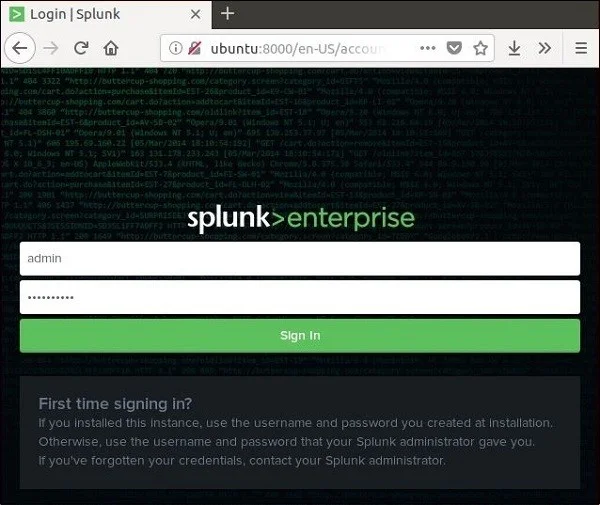
Splunk for Linux can be installed using RPM, DEB or .tar packages. Below are the steps using the DEB installer for Debian/Ubuntu-based systems.
To understand the true workings and performance of this platform, you must go through its technical concepts and terminologies. It will help you learn more about the various aspects of this platform.
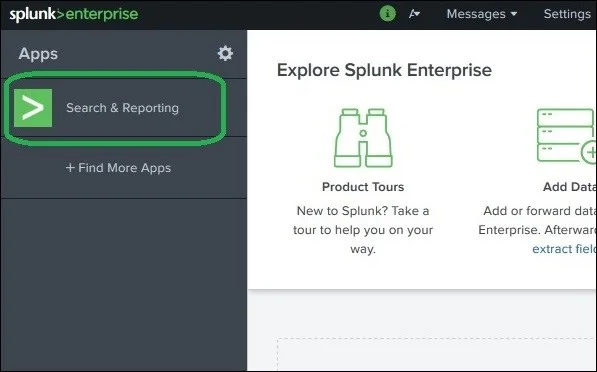
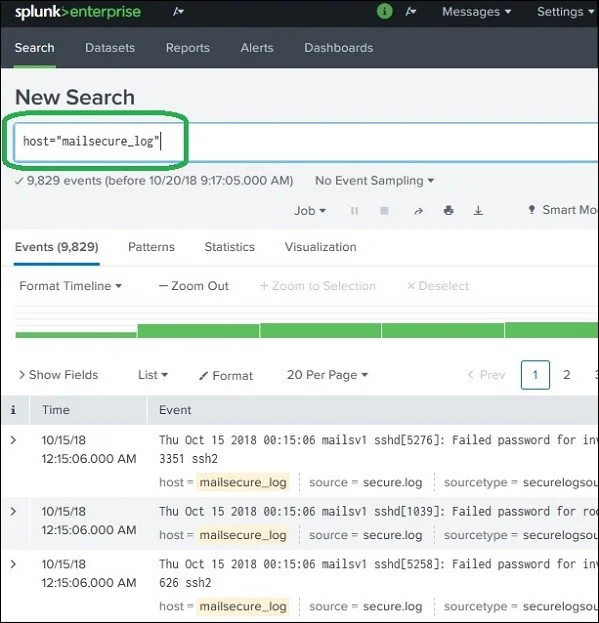
It has robust functionality for searching log files from any dataset. A special option named Search & Reporting is available at the left side of the bar in its user interface.
By clicking on this option, you will find a search bar on your screen. This search bar will show all types of files available in the DB if you provide it with the right format as shown below. Searching different types of files requires different types of formats. Here we are searching for the host names.
Field is a searchable name or value pair within event data. It forms the building blocks of searches, reports and data models. In this platform, we can extract default fields like Host, Source and Sourcetype. It allows us to build custom fields through techniques like field extraction, index time and search time.
It analyzes raw log to identify and build new fields.
It creates fields during the data indexing process, which can improve search performance.
It builds fields during the search itself, which provides flexibility but can impact performance on large sets.
Real-time alerts monitor running events and trigger actions frequently according to search results or user conditions. One can create these alerts with per-result or rolling time window triggering. Creating them involves the following steps.
Schedule Reports are saved searches that run automatically on a regular interval. These are generally used for generating reports, sending alerts or populating summary indexes. We can also configure them to perform operations like logging events or emailing results. The following four actions can be defined for scheduling reports.
Event types categorize common types of events for easier searching and reporting. Tags, on the other hand, allow for the grouping of event data across different sources and event types. Both of these are responsible for streamlining the process of finding, analyzing and reporting on specific types of information. Here are some of the key differences between them -
| Feature | Event Types | Tags |
| Scope | Broader categories | Specific labels |
| Purpose | Organizing data | Enriching data with context |
| Syntax | Search expressions | Field/value pairs |
| Location | eventtypes.conf | Various, including tags.conf |
Data pipeline is defined as a combination of different steps to extract, transform and load raw information from different sources. It provides fine details for further analysis and business processes. This platform provides different types of data pipelines catering to different business requirements.
Splunk provides multiple visualization features. It has the capability to convert raw information into intuitive maps, charts, graphs and dashboards. This capability allows individuals to uncover insights, detect anomalies and understand complex information effectively.
Visualization can be used in both dashboards: Classic Simple XML and Dashboard Studio. The Classic Simple XML uses XML source code, whereas Dashboard Studio uses JSON source code. We can customize the visualization by editing source code or using a visual editor.
Discussing all the applications of Splunk here is nearly impossible. Yes, you will be able to learn more about them during your Splunk course. And if you decide to go for Splunk certification, then you will get to know about everything during your training period. Here are a few places where this platform is useful:
Related Article- Splunk Fundamentals: Get Started with Data Analytics and Visualization
Whether or not to learn this platform is a big question. Is it really worth it and does it actually have a bright future? Too many questions and not enough time. To give you a better idea about the why's, let us look at a few benefits of Splunk training.
Here are a few ways in which Splunk online training can help you build a successful career:
The Splunk Core Certified User Certification is a professional certification designed for beginners who wish to demonstrate their proficiency in employing core Splunk Enterprise features. Further, it provides a variety of certification including:
There is a lot to learn about Splunk since it is a leading platform today. While covering it all in a blog is difficult, you can still learn it all with the help of the best Splunk course or other online resources. Since there are no prerequisites to learning Splunk, anyone can make a career in this field. All you need is to have a zest to learn and that is enough.
Ans. Learning Splunk is not that hard but if you wish to master it, then it will take some time.
Ans. There are a lot of online portals where you can get free short modules or practice sessions. However, if you want to learn it so that you can make a career in it, then we suggest you go with a full-fledged course or learn through Splunk tutorial.
Ans. Yes, the Splunk Core Certified User certification is issued by Splunk itself.
Ans. Splunk is a well-known software platform that is used for searching, visualizing, and analyzing machine-generated data.
Ans. Companies from all industries like electricity, gas, oil, banking, financial services, communication, etc., use Splunk.
Ans. A Splunk tutorial simplifies learning by covering data indexing, search queries, and dashboard creation step by step.