Today, businesses collect a lot of data, but this data is unstructured and unorganized. One team may have customer information that another team does not have. This causes a lot of confusion and slows down work, and can lead to wrong business decisions. It is very important for the businesses to keep the data organized and structured.
Data modeling solves this problem directly. This makes the whole company's data clean and a common map for everyone. This map makes sure that every department of the company sees the same information. It makes the data trustworthy and easy to use.
Data modeling is the process of making a visual plan for your data. This plan shows how all data is related and stored. This is one of the very important processes for any business. It helps people to understand the data easily. It leads to better planning and smarter business decisions.
This blog will help you to understand data modeling from scratch. It covers everything you need to know about data modeling, from what is data modeling to the modern data modeling tools. Let's begin.
Data modeling is the process of creating a visual map of a company's data. It is a planning step that helps you think carefully about your information before building anything. The result is a diagram known as a model. This model shows the different types of information (entities), their specific details (attributes) and the connections between them (relationships).
Let's look at an example from an e-commerce website.
Defining these elements early helps everyone agree on the plan. Both the business and technical teams get a clear picture of the data. This process ensures the final database is accurate, consistent and meets all the business needs.
The building blocks of all data models you use are comprised of various pieces. If you want to read, create, and assess any data model with ease, learning these components is essential.
Entities refer to the physical things or ideas you want to store as data in your business’s databases. For example, if you have a database for an e-commerce website, there will be tables in your database for each entity — e.g., Customer, Product, Order, Shipment. Think of the entities as the ‘nouns’ of your system.
Attributes are specific attributes associated with entities; they are placed in the columns of your database tables. Each attribute contains one specific kind of information and cannot be diminished. For example, when creating an entity of a customer, the customer entity will have the following: CustomerID, FirstName, LastName, Email, PhoneNumber.
Relationships define how entities are connected. There are three types:
| Relationship | Meaning | Example |
| One-to-One (1:1) | Each record in Table A links to exactly one record in Table B | One employee has one company ID badge |
| One-to-Many (1:M) | One record in Table A links to many records in Table B | One customer places many orders |
| Many-to-Many (M:N) | Many records in Table A link to many records in Table B | Students enroll in many courses, and courses have many students |
Constraints are rules that enforce data accuracy and prevent bad or duplicate data from being saved.
| Constraint | What It Does |
| Primary Key | Uniquely identifies each row in a table. No duplicates allowed. |
| Foreign Key | Links one table to another by referencing the primary key of a related table. |
| Unique Constraint | Ensures all values in a column are different. Example: no two users share the same email. |
| NOT NULL | Ensures a column cannot be left empty. Example: every order must have an OrderDate. |
| Check Constraint | Ensures a value meets a condition. Example: Price must always be greater than 0. |
Meta data is the information you create about the data in your model or application (e.g., definitions of fields, origin of data, ownership, frequency of updates, business rules about data). If you maintain good meta data, it will help you build a better understanding of your model, allow for easier maintenance of the model, and allow for easier auditing of the model. Having strong meta data is also an important component of a data governance program.
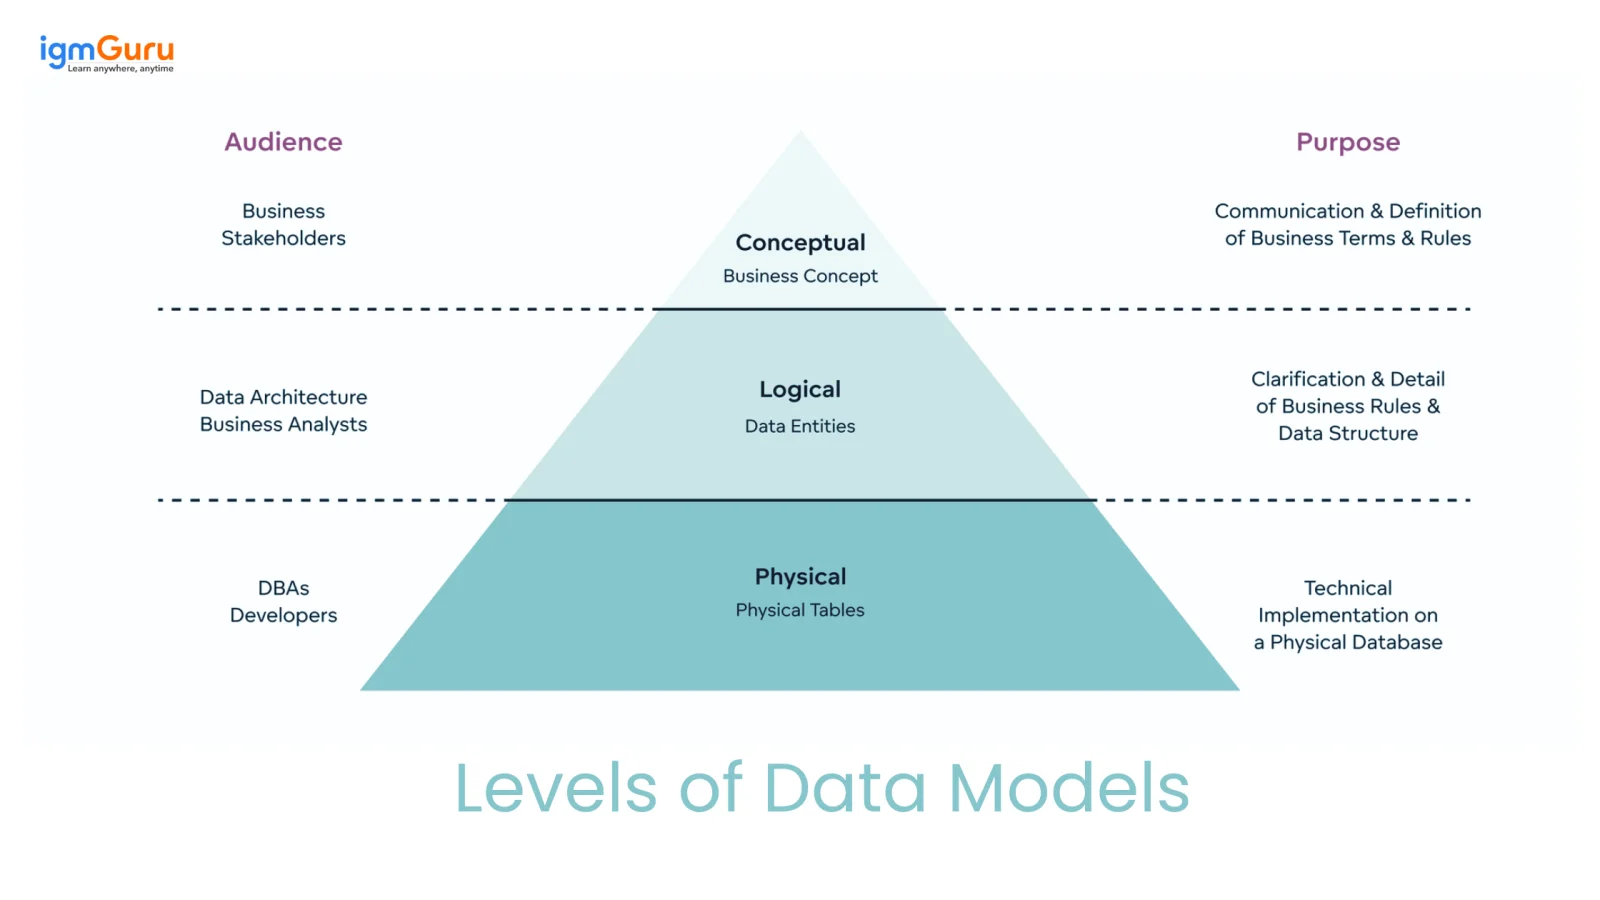
Data modeling is a process with several phases. It starts with a simple, high-level view and moves to a detailed, technical plan. This process has three different levels of data models.
This is the highest-level view of the data. The conceptual model focuses only on the business side of things and does not include technical details. It shows the main entities and how they are related to each other. Business experts and managers usually create this model.
The logical model adds more detail to the plan. It connects the business ideas to the database design. This model defines all the attributes for each entity and includes concepts like primary and foreign keys to show relationships. A key point is that this model is not tied to one specific database system. It can be used for any technology like Oracle or SQL Server.
This is the final and most detailed plan. It is the blueprint used to actually create the database. The physical model turns the logical model into a plan for one specific database system. It includes every detail that developers and Database Administrators (DBAs) need to build and run the database.
Read Also: Data Science Tutorial for Beginners
Creating a robust data model follows a logical and iterative sequence of steps.
Begin by identifying the core nouns in your business requirements. If a requirement states, 'A customer places an order for multiple products,' you've just found your primary entities: Customer, Order and Product.
For each entity, list all the attributes or characteristics you need to store. What do you need to know about a Product? Probably its name, description, price and a unique identifier like a SKU.
Define how the entities connect and the rules of that connection (known as cardinality).
In this type of relationship, one instance of Entity A has exactly one corresponding instance of Entity B. This is typically the least common type of relationship because of the frequency in which tables are divided into multiple smaller tables, oftentimes due to security concerns or performance issues.
For example: A person has exactly one passport; A passport is owned by only one person. Thus in the database there will be an instance of PersonID stored as a Foreign Key within the Passport table.
In this type of relationship, there is one instance of Entity A that can relate to many instances of Entity B, however every instance of Entity B can relate only to a single instance of Entity A, making this the most frequently used type of relationship in designing databases.
For example: One department has many employees; Each employee belongs to one department. Therefore, in the database we will see DepartmentID as a Foreign Key in the Employee table.
In this type of relationship, many instances of Entity A can relate to many instances of Entity B, thus this is also the most complex form of relationship. In relational database terms, a bridge table (also referred to as a junction table) is created between those two entities containing both Foreign Keys that point to each other.
Example: A Product can appear in many Orders; An Order can contain many Products. To create this relationship in a relational database, a junction table will be created between the Product and Order tables and both Foreign Keys will exist within that junction table.
This is a critical validation step. Go through every piece of data you need to capture and ensure it has a logical home in one of your entities. For instance, Shipping Address belongs to the Order entity, not the Product entity.
The data model is a communication tool. Share it with business stakeholders, developers and DBAs. This collaborative review ensures that the model is technically sound, accurately reflects all business requirements and catches potential design flaws before a single line of code is written.
The three levels show the different stages of data modeling. There are also different techniques used to structure the data itself.
This is one of the oldest types of models. It organizes data in a structure that looks like a tree. Each piece of information has only one parent record. This creates a simple top-down system. It works well for data like an organizational chart but is not very flexible for more complex connections.
The network model was an improvement on the hierarchical model. It allows a record to have many parent and child records. This creates a more flexible structure that looks like a graph. However, this extra complexity made these models harder to build and manage.
The relational model was created in the 1970s. It is the most common model used today for many applications. This model organizes data into simple tables with rows and columns. Special keys are used to manage the connections between tables. It became popular because it is simple and flexible. The powerful SQL language used to get data from it also helped make it the leading model for many years.
The ER-Model is not a type of database. It is a visual method used to plan and design relational databases. This model uses special shapes to represent different parts of the data. For example, it uses boxes for entities, ovals for attributes, and diamonds for relationships. Designers use this method to create conceptual and logical models. These models are later turned into a physical database.
This model treats data as objects, much like in object-oriented programming. Each object holds both the data (attributes) and the actions that can be done with that data (methods). This model is helpful for working with complex types of data. It is not as common for general business databases.
This is a modern model made for data warehousing and business reports. The main goal of this model is to make data fast and easy to search and analyze. It organizes information into two main types. Facts are business events that can be measured, like a sale. Dimensions provide the context for the facts, such as who, what, where, and when. This structure is used to create popular designs like the Star Schema.
The Dimensional Model is represented by two design patterns; the Star and Snowflake Schemas. These two structures are designed mainly for use in data warehouses and business intelligence (BI) applications.
A star schema is named after the star formation it takes on when drawn out on paper, as it has one fact table (the centre piece of the star) and surrounding dimension tables (the points of the star).
Fact Table (Centre): The fact table stores the measurable business transactional data that you want to analyze, such as sales amount, number of sales orders, revenue, clicks, etc. It holds the foreign keys to the associated dimension tables.
Dimension Tables (Outer): Dimension tables store a descriptive contextual framework to help answer the four critical components of any analysis (who, what, where, and when) about the data in the fact table. Examples include, customer information, product information, date, location etc.
For example: If you have a sales fact table along with the customer, product, date, and store dimension tables, your analyst could easily answer the question: “What was the total sales amount by region during the 4th quarter?”. The star schema is optimal for use with data warehousing as it has less complex joins (and there are fewer of them) therefore, BI tools, such as Power BI and Tableau are optimised for working with star schemas. The snowflake schema is an extension of the star schema; the dimension tables of the snowflake schema have been broken down (normalised) further into sub dimension tables resulting in a more complex layout and will look like that of a snowflake.
| Feature | Star Schema | Snowflake Schema |
| Structure | Flat dimension tables | Dimension tables split into sub-tables |
| Query Speed | Faster — fewer joins | Slightly slower — more joins |
| Storage | Uses more storage | Uses less storage |
| Complexity | Simpler to design | More complex |
| Best For | Dashboards and fast reporting | Large warehouses where storage matters |
Which to choose? For most BI and reporting use cases, Star Schema is preferred. Snowflake Schema is better when storage efficiency is a priority or when dimension data is very large.
Read Also: A Complete Guide To Data Modeling in MongoDB
Investing time in proper data modeling isn't just a technical exercise; it delivers tangible business value:
Although data modeling creates a lot of value, it does present some significant challenges. Here are some of the most common data modeling challenges you will face:
The number of models available makes it difficult to select the correct one for your use case. For example, a reporting model may not be effective for processing high transaction volumes. The best approach is to start with the primary business use case before committing to any type of model.
Large organisations collect information from dozens of systems, such as CRMs, ERPs and web-based solutions, in addition to third-party applications. Different data formats and naming conventions are used throughout this collection of systems (e.g., how "customer" is defined varies from system to system). Integrating the data from each of these sources into one consistent model is a significant challenge.
Highly normalised databases are effective at eliminating redundancy but can lead to slower query performance due to the large number of joins necessary to retrieve all required records. On the other hand, analytical workloads require slightly denormalised structures to be successful with performance; therefore, understanding how to balance normalisation and performance is a very important design skill.
Because business needs evolve consistently, the use of separate models for each system (BI/ETL and Analytics) leads to organizations having metrics defined differently across teams. This leads to a lack of trust in metrics. A single, properly governed data model alleviates this issue.
The revenue/customer basis of most business teams is the language they understand, while technical teams tend to operate in terms of tables and keys. Creating a good line of communication and working together on all aspects of the modeling will ensure goals are met for all parties involved in the project from the beginning.
Even experienced teams make these mistakes. Knowing them in advance saves you from costly rework later. Here are some common mistakes that you should avoid:
| Mistake | How to Avoid It |
| Skipping the conceptual stage — jumping to physical design without agreeing on business requirements first | Always build a conceptual model first and get business sign-off on entities and relationships before any technical work |
| Unclear naming conventions — naming tables "tbl_1" or columns "data1" | Use consistent, descriptive names. Table names should be singular nouns (Customer, not Customers). Column names should clearly state what they store (OrderDate, not Date1). |
| Ignoring scalability — designing for today's data without thinking about growth | Ask: “What happens when this table has 100 million rows?” Plan indexing strategies early. |
| Over-normalizing analytical workloads — applying strict 3NF to a data warehouse | Analytical databases often benefit from denormalized designs like Star Schema. Match normalization to your use case. |
| Not validating with stakeholders — finalizing a model without review | Run a formal review session before handing the model to developers. Catch flaws on paper, not in production. |
| Treating the model as a one-time deliverable — never updating it after launch | Schedule regular model reviews whenever business requirements change. A data model should be a living document. |
By following these guidelines you can create models that are accurate, sustainable and truly beneficial:
While you can start with a whiteboard, professional tools streamline the modeling process, facilitate collaboration and automate parts of the workflow.

Data modeling is a key step for managing information well. This blog post explained the entire topic. It covered the definition, different levels and the step-by-step process. The guide also showed various modeling techniques, their benefits and modern tools. The future of data modeling looks exciting. New technology trends like AI will help automate the process. This will make creating data models faster and easier. Models will also become smarter. They will handle all types of data better. Understanding data modeling is a very useful skill. It helps turn messy data into a valuable business asset.
It starts with identifying business requirements, then creating diagrams that show entities, attributes, and relationships. These models guide database development and structure.
Data architects, analysts, and database developers use it to design systems, but business stakeholders also rely on it to understand how data supports operations.
Popular tools include ER/Studio, ERwin, IBM InfoSphere Data Architect, and open-source options like MySQL Workbench.
Common questions include explaining normalization, ER diagrams, primary vs foreign keys, types of relationships and differences between logical and physical models.
Course Schedule
| Course Name | Batch Type | Details |
| Data Modeling Training | Every Weekday | View Details |
| Data Modeling Training | Every Weekend | View Details |


Top Salesforce Service Cloud Interview Questions and Answers
July 27th, 2026