Ever thought how data enthusiasts convert raw, messy data into meaningful insights that can change the world or at least a business? This is achieved through different tools, techniques and processes, one of which is data manipulation. But what is data manipulation? This is one of the initial procedures in data analysis for sorting, arranging and connecting the data. This eases users or data analysts in performing necessary insights or business directives.
It surrounds a broad range of tools and languages, which include coding and non-coding techniques. This is not only done by data analysts but also by business people and accountants. This article will give an in-depth explanation on what is data manipulation, its examples, purpose, and top tools.
Explore igmGuru's Data Science with R Training for a complete understanding.
Data Manipulation is the practice of manipulating (developing, arranging, deleting) data points in the given data to get insights easily. We all know the majority of the given data is unstructured. This procedure is a fundamental step in data analysis, data mining and data preparation for machine learning. It is important to take informed decisions and derive conclusions from the raw data. Performing data manipulation includes-
Let us take a look at our next section on what is data manipulation language. It generally requires a type of database language called data manipulation language (DML). With DML, we can reorganize data by modifying it within its database program. It communicates with the database program to make adjustments that require this language without losing even a single data strand during organization.
This language manages user requests, offering a way for accessibility and manipulating the data users store in a database. Some common functions of this language involve inserting, updating and regaining data from the database. Here are some DML commands used in this process.
Explore the top Data Analysis Tools popular today.
Data manipulation is all about making changes or modifying the data. It makes it more readable and organized, generating new insights and meeting particular requirements and needs. Some data manipulation examples are–
Marketing teams segment customers by purchasing history, behavioral patterns and demographic information through the manipulation of data. Marketing persons can tailor their messaging, organize personalized customer experiences and boost customer retention.
Accounting and financial departments manipulate their financial data to create reports, income statements and balance sheets. Companies can judge performance and assess profitability by calculating key metrics and aggregating transactional data.
Healthcare sectors can analyze their medical research, clinical trials and patient information with data manipulation techniques. It can aggregate patient data, control risk factors and predict outcomes for improving patient care and optimizing treatment facilities.
Retail and e-commerce business sectors can manipulate sales data to empower trend analysis. Vendors can identify their bestselling products and predict demand by manipulating data.
Website administrators and owners can locate the most viewed web pages, traffic sources and more through web server logs. Areas for improvement are pinned and refocused on optimization efforts.
Get a complete roadmap to Learn Data Science.
The next question that comes to mind is what is the purpose of data manipulation? Its main purpose is organizing, cleaning, changing and structuring raw data into a usable format for analysis. Analysts can derive meaningful insights through filtering, aggregating, and combining data. They can generate reports and identify key trends or patterns through different sources. It makes data ready for interpretation and decision-making.
It is important because it lets you access information easily, which is critical for a particular business and its goals. This can be customized for identifying different data sets as a company grows or makes changes due to market demand. It is an important tool for identifying and correcting data redundancies in reporting.
Organizations can manipulate data to convert it into useful insights for stakeholder presentations, project or financial decisions and trend or success measurements. Let us take a look at the reasons why we choose to implement this process.
Users can select a data subset matching specific conditions or criteria in filtering and subsetting. These techniques filter out unwanted or unrelated data points. Users can create a more relevant dataset that generates more accurate insights.
Sorting can arrange data in chronological, alphabetical or numerical order. Through sorting, we can arrange data in a specified order, which makes organizing easier for evaluation. Sorting clarifies further clarification and analysis as sorted data is more straightforward to plot or summarize.
Aggregation unifies data points into summary statistics like averages, counts, or totals through different functions. Grouping is for shared attributes or criteria for sorting data into subsets. These techniques provide different levels of granularity for analysis, summarization and comparisons.
Data from different datasets or sources is combined into a single dataset during joining and merging. These techniques combine data from different sources, resulting in finer and more accurate datasets. It authorizes an in-depth analysis that considers different data dimensions.
Spreadsheet software like Microsoft Excel applies pivot tables and cross-tabulations for summarizing data and analyzing it in a tabular form. Manipulating and rearranging data can identify trends, relationships and patterns.
Data transformation functions involve data/time conversions, string manipulations and mathematical calculations. Users can derive new metrics or variables from existing data by changing data from one structure to another. Changing data into constant formats, developing new features or variables and converting data types improve the reliability and quality of data.
Window functions and analytical functions fall in the most advanced SQL techniques. It analyses and calculates over data subsets. Users can rank data, compute moving averages and perform more complicated analytical processes.
Text and sentiment analysis techniques manipulate textual data to derive insights. Common textual data like survey responses, questionnaires, social media activity, customer reviews and chat transcripts. These techniques hold natural language processing (NLP) algorithms to analyze text, identify sentiment and extract the needed information.
Related Article - R Programming Tutorial For Beginners
Data manipulation tools modify data and make it easier to read or organize. Users can identify patterns in data that might not be obvious. A right tool can organize a data log alphabetically so that confidential entries can be found easily. Here are some of the top tools in this practice.
It is a versatile spreadsheet tool for basic manipulation and analysis of data. They provide basic manipulation abilities like filtering, sorting and simple calculations. Microsoft Excel is among the most common and famous software for data analysis. Its simplicity and versatility make it a strong data analysis tool. Industries using Excel for document management are mainly from the US around 76k customers.
Pandas library in Python is famous for manipulating data. There are strong Python data types, structures, and tools. Python is a famous choice for analyzing data because it is easy to use and can do different things. It is extremely versatile and has a huge range of resource libraries for different data analytics tasks.
Tableau prep is a data preparation tool for cleaning, shaping and enriching data before analysis in Tableau. It is a highly famous tool for visualizing data as it is easy to use and is very powerful. With this one can analyze and visualize data in a structured format with extensive coding expertise.
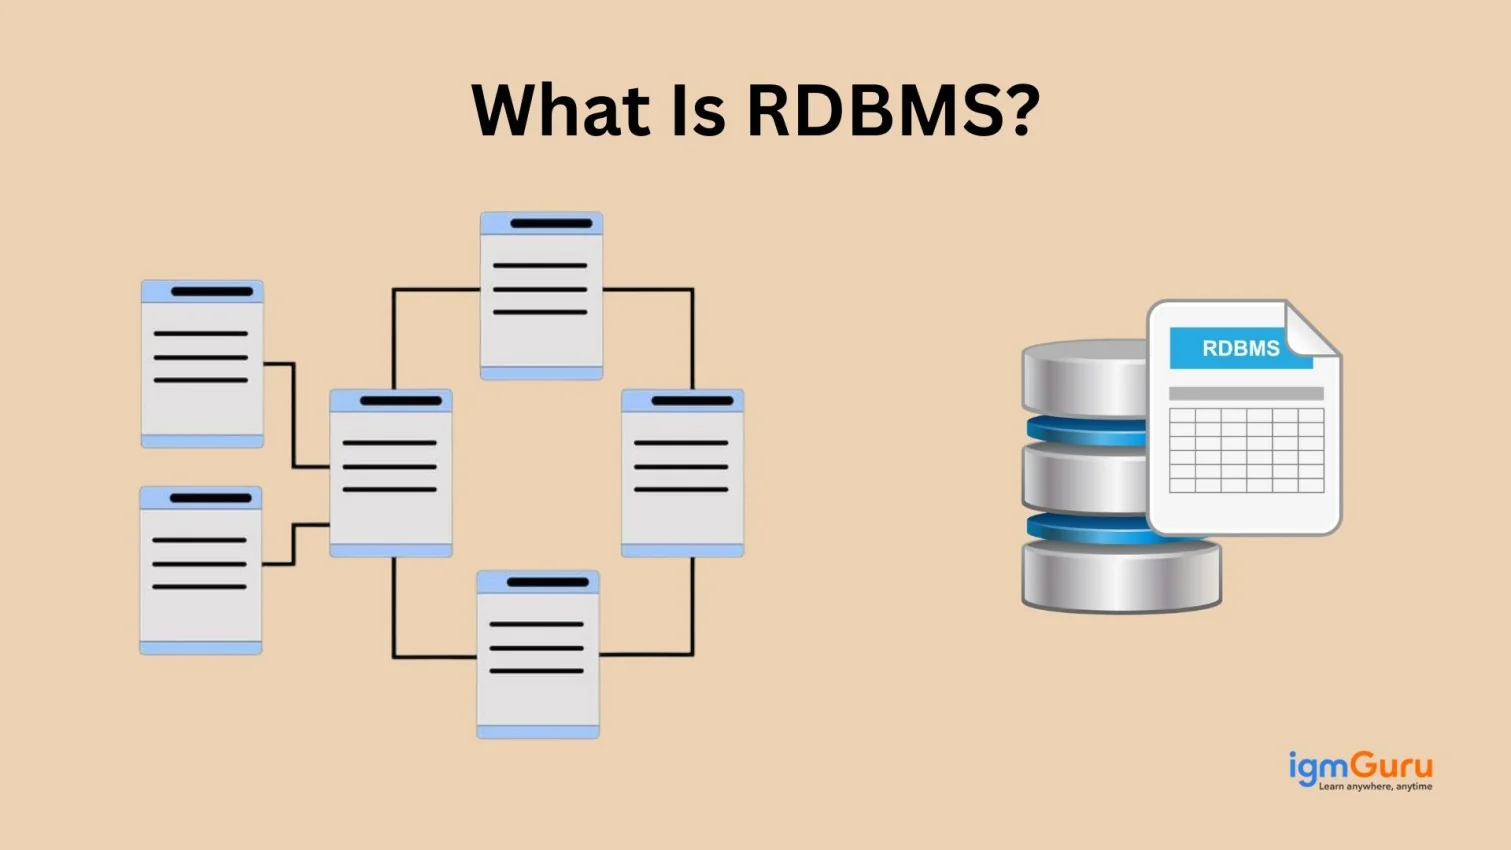
Structured Query Language handles and manipulates data in relational databases. It is a domain-specific language for managing data, specifically in a relational database management system. SQL is a basic tool for working with databases. Users can ask questions and get specific information from databases at high speed.
R language is a statistical programming language with packages like dplyr and tidyr which excel here. It is one of the best data analytics tools for data mining, modeling and heavy statistical computing. It is a free programming language and computing environment known for its significance on statistics and graphical data visualization.
Successful data manipulation lets data professionals completely leverage raw data, improve quality and obtain valuable insights. Data teams can rest easy as the data they are working on is accurate and relevant. Caused by unrestricted globalization and digitization industries, there is a greater need for correct data for good business insights. Many famous programming languages/tools like Python, R, SQL, and Excel are used for data manipulation.
It is the act of deliberately modifying (destroying, manipulating or editing) data via unauthorized channels.
Attackers can insert, delete or manipulate data at rest in order to influence external outcomes or hide activity. This leads to threatening the integrity of the data.
It is the procedure of modifying raw data into suitable data for analysis through a machine learning model. Data manipulation in ML involves organizing, cleaning and structuring the data with techniques like filtering, sorting, scaling and feature engineering.
Course Schedule
| Course Name | Batch Type | Details |
| Data Science Courses | Every Weekday | View Details |
| Data Science Courses | Every Weekend | View Details |