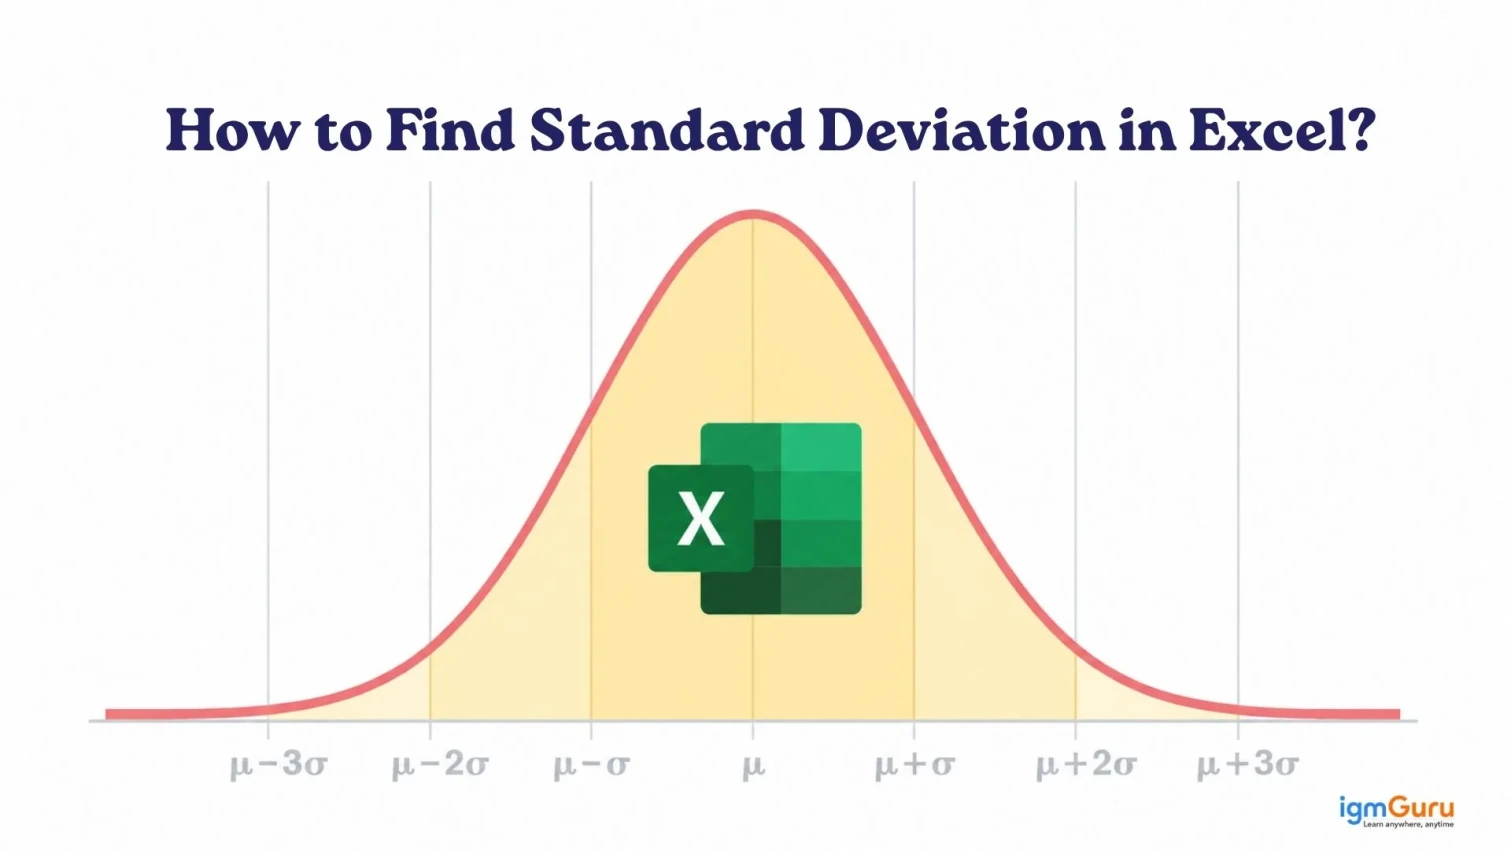
Standard deviation is one of the most important statistical measures in data analysis. It tells you how spread out your data is, whether values are clustered tightly around the average or scattered widely. And while the manual math behind it can be intimidating, Excel makes it remarkably simple.
In this guide, you will learn exactly how to find standard deviation in Excel, which function to use, when to use it, how to interpret the result, and how to avoid the most common mistakes beginners make.
Whether you are a student, a data analyst, an HR professional, or just someone working with numbers in a spreadsheet, this article covers everything you need.
Read Also: Power Automate Tutorial For Beginners
Standard deviation measures how much individual values in a dataset deviate from the mean (average). A low standard deviation means most values are close to the average. A high standard deviation means values are spread out over a wider range.
Example: Suppose you have test scores for a class of 30 students. The average is 70. If the standard deviation is 3, most students scored between 67 and 73, tightly grouped. If the standard deviation is 18, scores range widely, perhaps from 40 to 100.
This measure is used in finance (measuring investment risk), quality control (monitoring manufacturing consistency), research (analyzing survey data), and countless other fields.
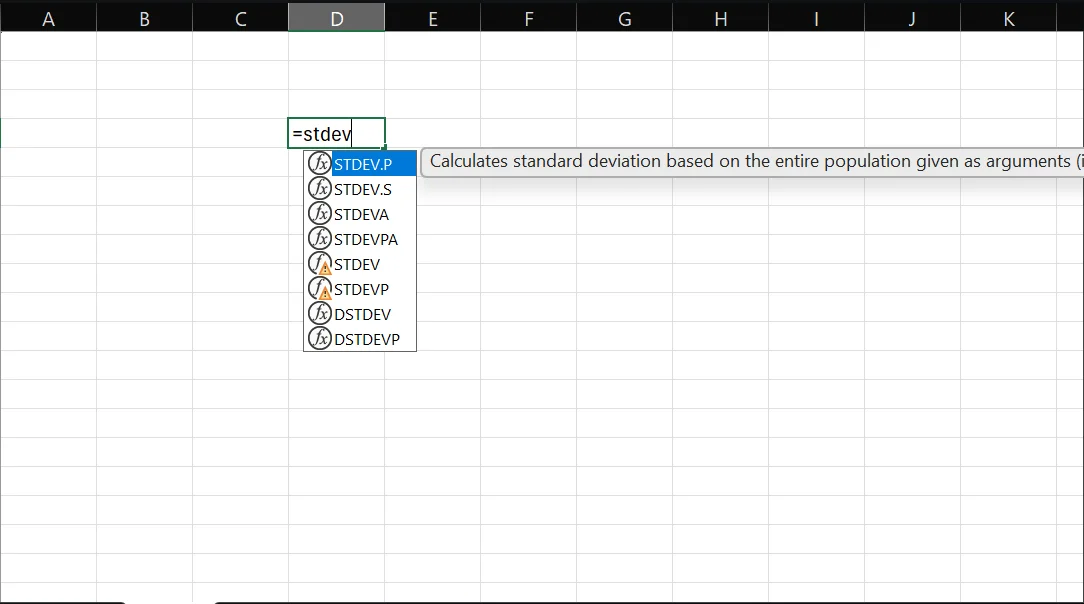
Excel does not have a single "standard deviation" button. Instead, it offers six dedicated functions that are suited to slightly different scenarios. Here is a clear overview:
| Function | Type | Includes Text/Logical Values? | Use When |
|---|---|---|---|
| STDEV.S | Sample | No | Data is a sample from a larger population (most common) |
| STDEV.P | Population | No | Data represents the entire population |
| STDEVA | Sample | Yes (text=0, TRUE=1, FALSE=0) | Sample data may include text or logical values |
| STDEVPA | Population | Yes | Full population data includes text or logical values |
| STDEV | Sample | No | Legacy function (Excel 2007 and earlier) |
| STDEVP | Population | No | Legacy function (Excel 2007 and earlier) |
For most everyday work, you will only need STDEV.S or STDEV.P. The legacy functions (STDEV and STDEVP) still work but are kept only for backward compatibility. You just have to avoid using them in new spreadsheets.
Also Read: How to Create a Dashboard in Excel? A step-by-step Guide
This is the single most important decision when calculating standard deviation in Excel, and it trips up a lot of beginners.
Population standard deviation (STDEV.P): Use this when your dataset contains every single member of the group you are analyzing. For example, if you have salary data for all 200 employees at a company and want to measure variation across that exact group, use STDEV.P.
Sample standard deviation (STDEV.S): Use this when your dataset is a subset drawn from a larger group. For example, if you surveyed 50 out of 10,000 customers to understand purchase behavior, use STDEV.S. This function applies a correction (divides by n-1 instead of n) to account for the uncertainty of working with a partial dataset.
Rule of thumb: In most real-world analysis, surveys, research, HR analytics, and quality control, you are working with a sample. STDEV.S is the default choice for the majority of use cases.
Place your data values in a single column (or row). For example, put test scores in cells B2 through B11.
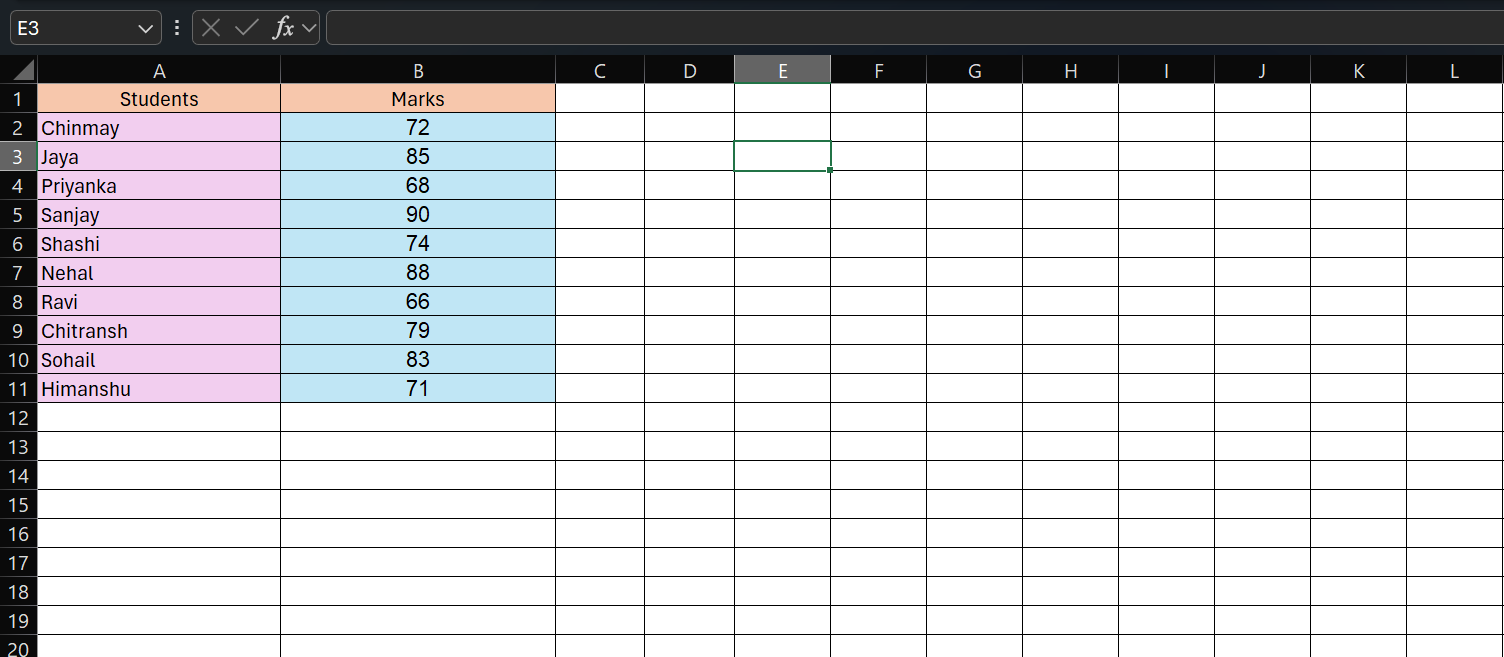
Select an empty cell where you want the standard deviation to appear, for example, B13.
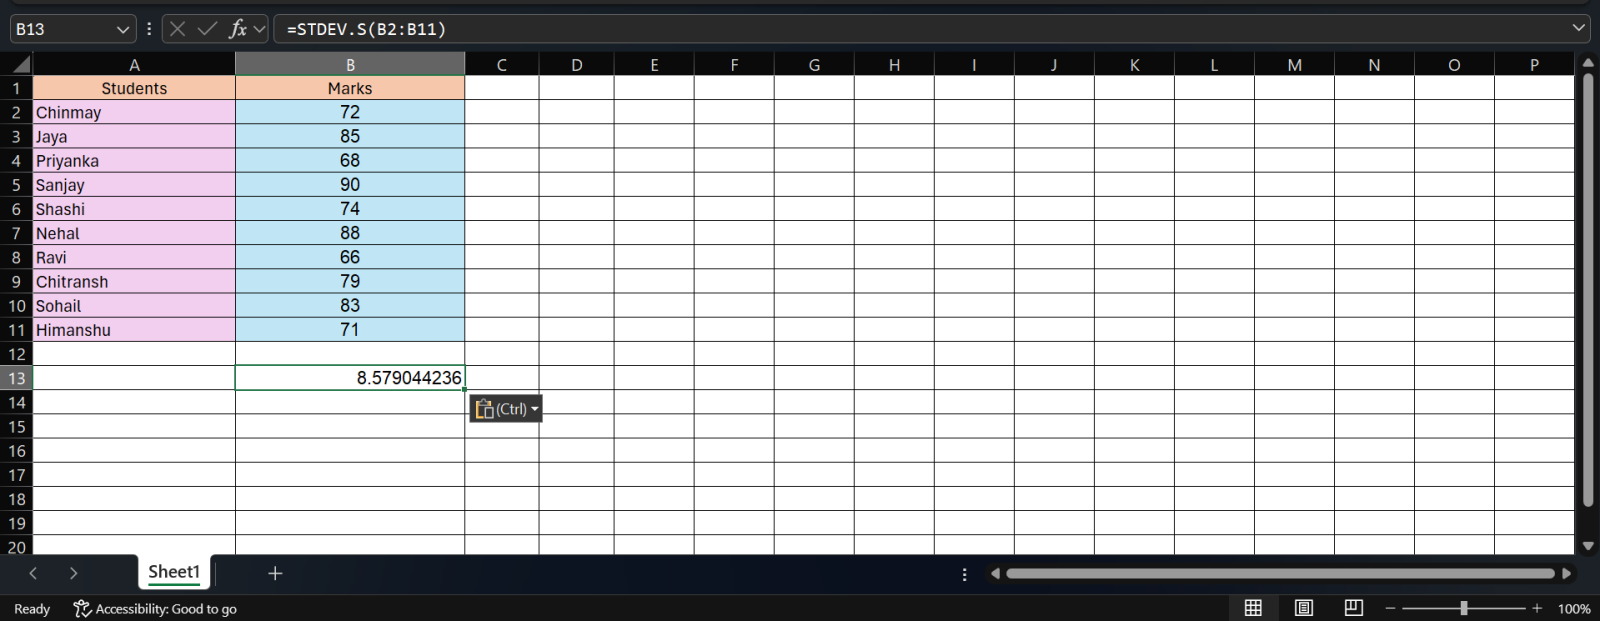
For a sample standard deviation, type:
| Formula |
=STDEV.S(B2:B11) |
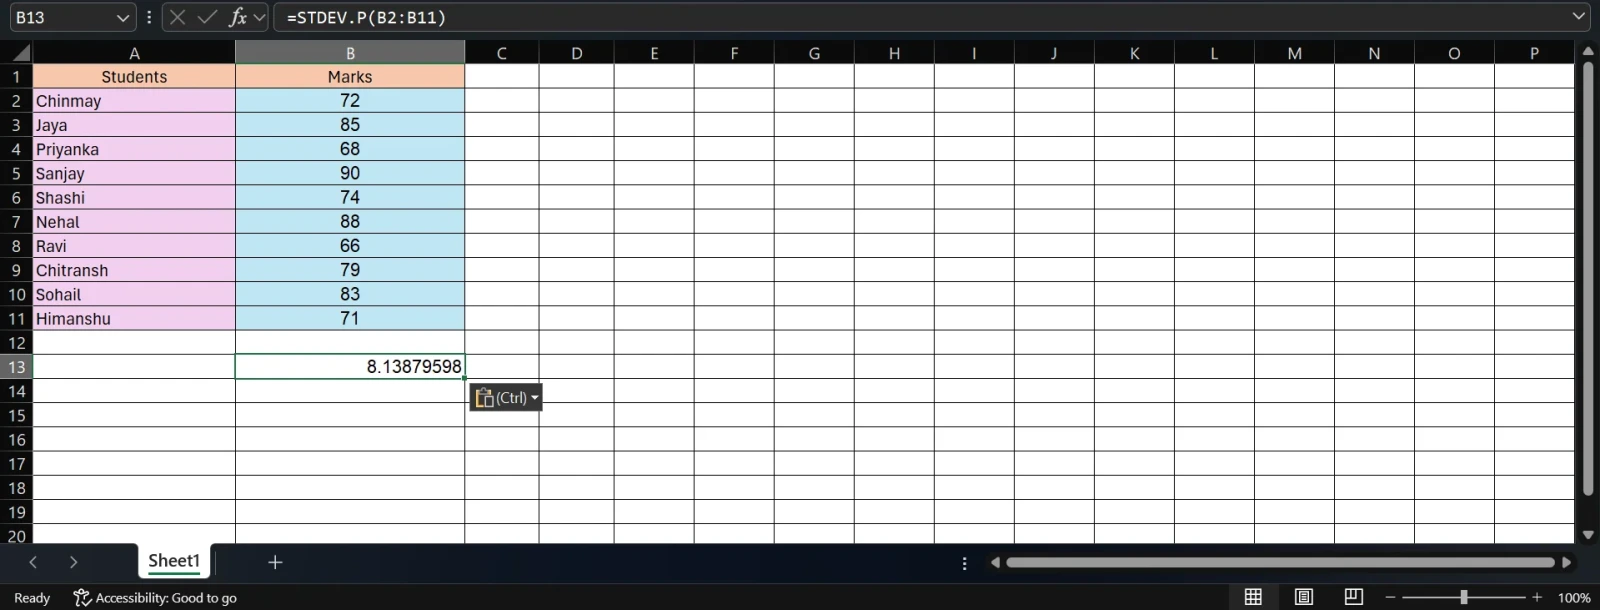
For a population standard deviation, type:
| Formula |
=STDEV.P(B2:B11) |
Related Article: What is Power Query?
Excel instantly calculates and displays the result. For the data above, STDEV.S returns approximately 8.20, meaning test scores typically vary by about 8 points from the average.
That is all it takes. No manual formulas, no calculators.
| Syntax |
=STDEV.S(number1, [number2], ...) |
Example 1, Range of cells:
| Formula |
=STDEV.S(A2:A50) |
Example 2, Multiple non-contiguous ranges:
| Formula |
=STDEV.S(A2:A25, C2:C25) |
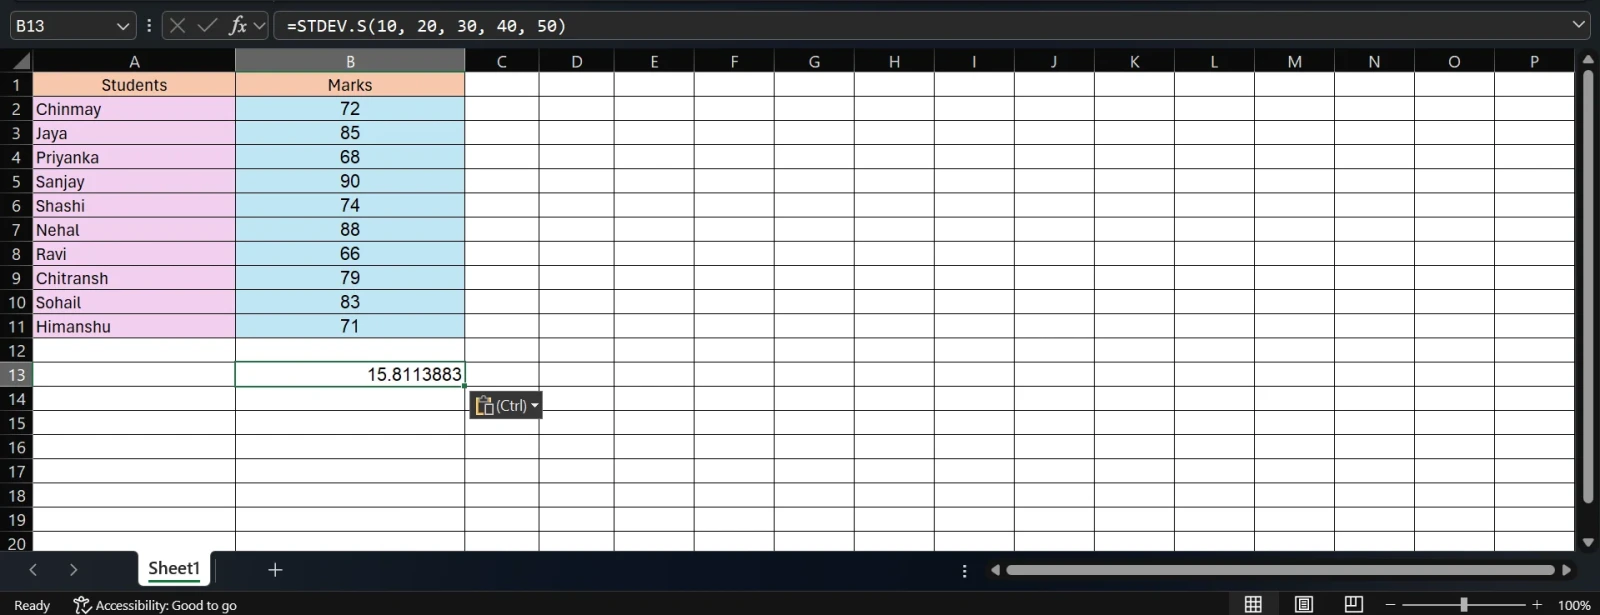
Example 3, Individual values:
| Formula |
=STDEV.S(10, 20, 30, 40, 50) |
Result: 15.81
Note: STDEV.S ignores text and logical (TRUE/FALSE) values in the range. If you need to include those, use STDEVA instead.
Also Read: XLOOKUP() vs. VLOOKUP()
STDEV.P Formula: Syntax and Examples
| Syntax |
=STDEV.P(number1, [number2], ...) |
The syntax is identical to STDEV.S, but the underlying calculation differs, STDEV.P divides by n (total count), while STDEV.S divides by n-1.
Example:
| Formula |
=STDEV.P(A2:A50) |
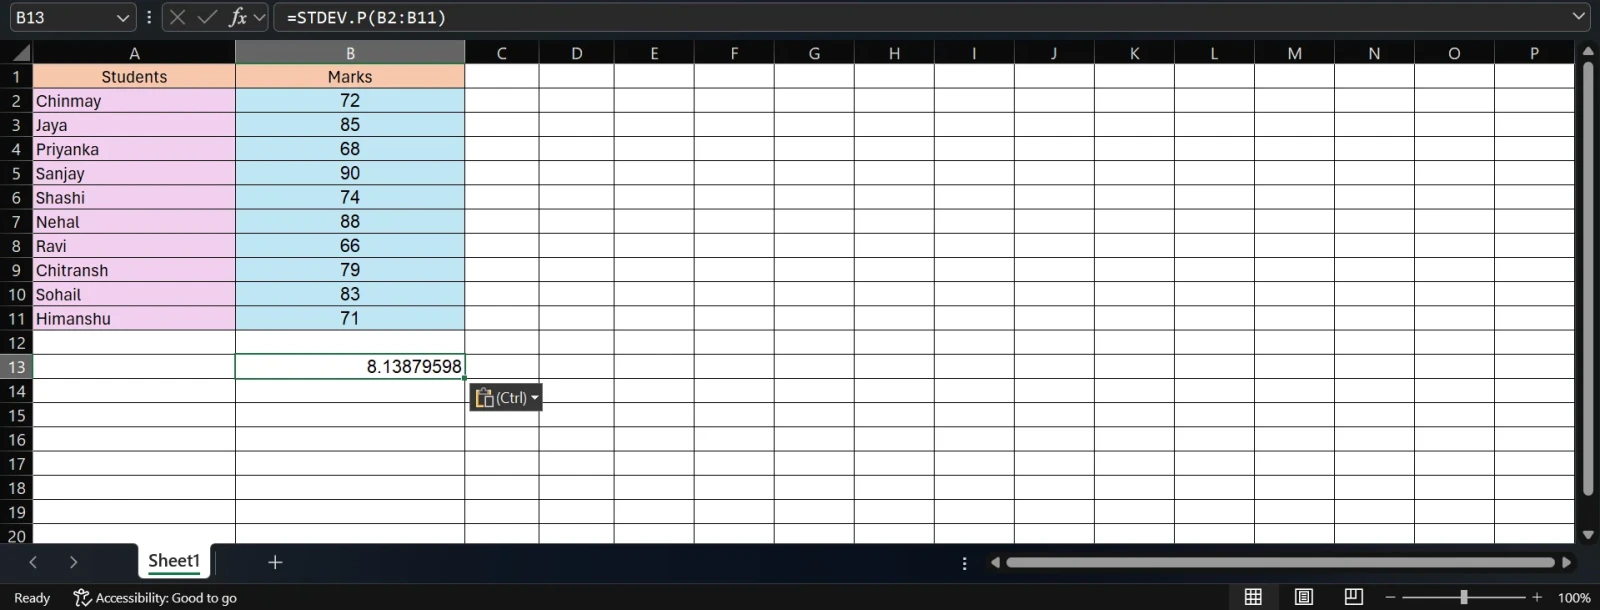
For small datasets, the difference between STDEV.S and STDEV.P results can be noticeable. For large datasets (hundreds of values or more), the difference becomes negligible.
In most clean datasets, these functions are not needed. But when your data might include:
...then STDEVA (sample) or STDEVPA (population) will give you results that account for those entries rather than silently ignoring them.
Example:
| Formula |
=STDEVA(A2:A30) |
Use these with caution, including text and logical values as 0 or 1 can significantly skew your standard deviation if those values are not meaningful numerically.
Read Also: How to Remove Spaces in Excel?
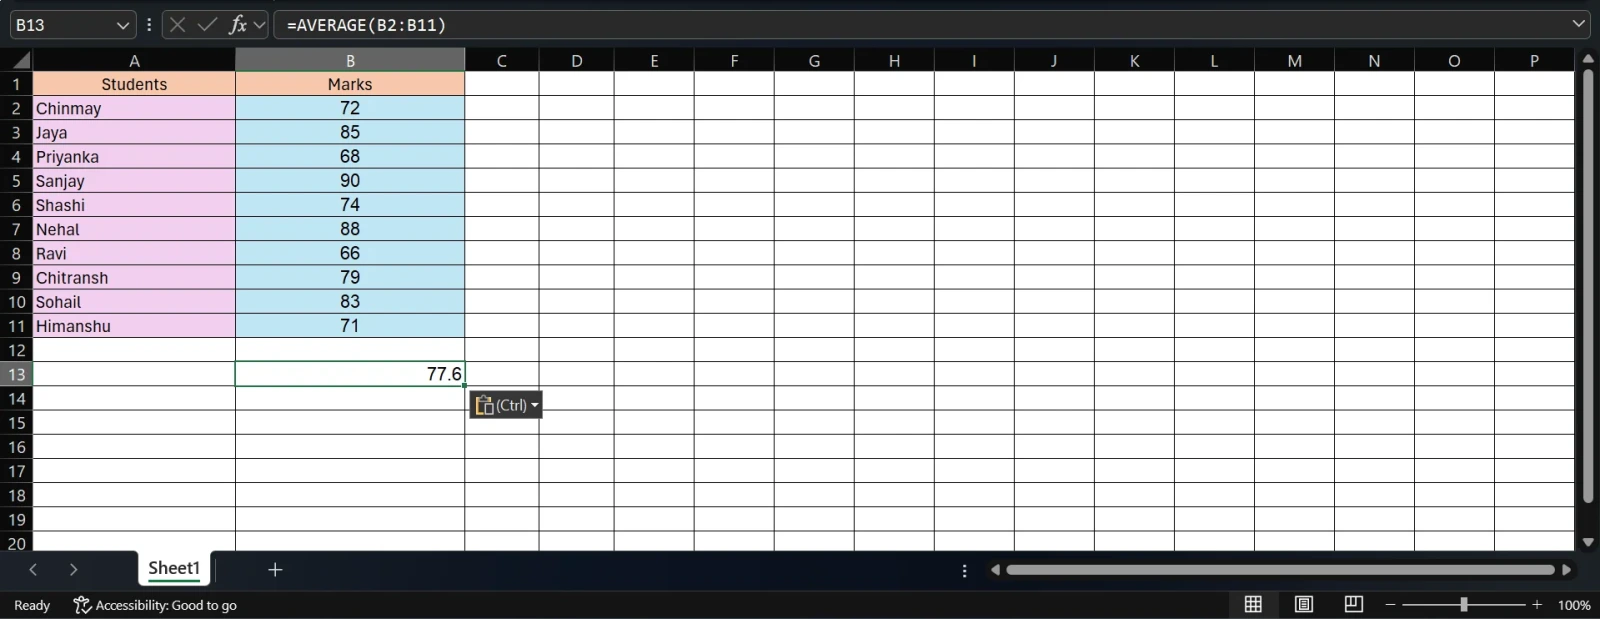
A common task is displaying both the mean (average) and the standard deviation side by side. Here is how:
Calculate the mean:
| Formula |
=AVERAGE(B2:B11) |
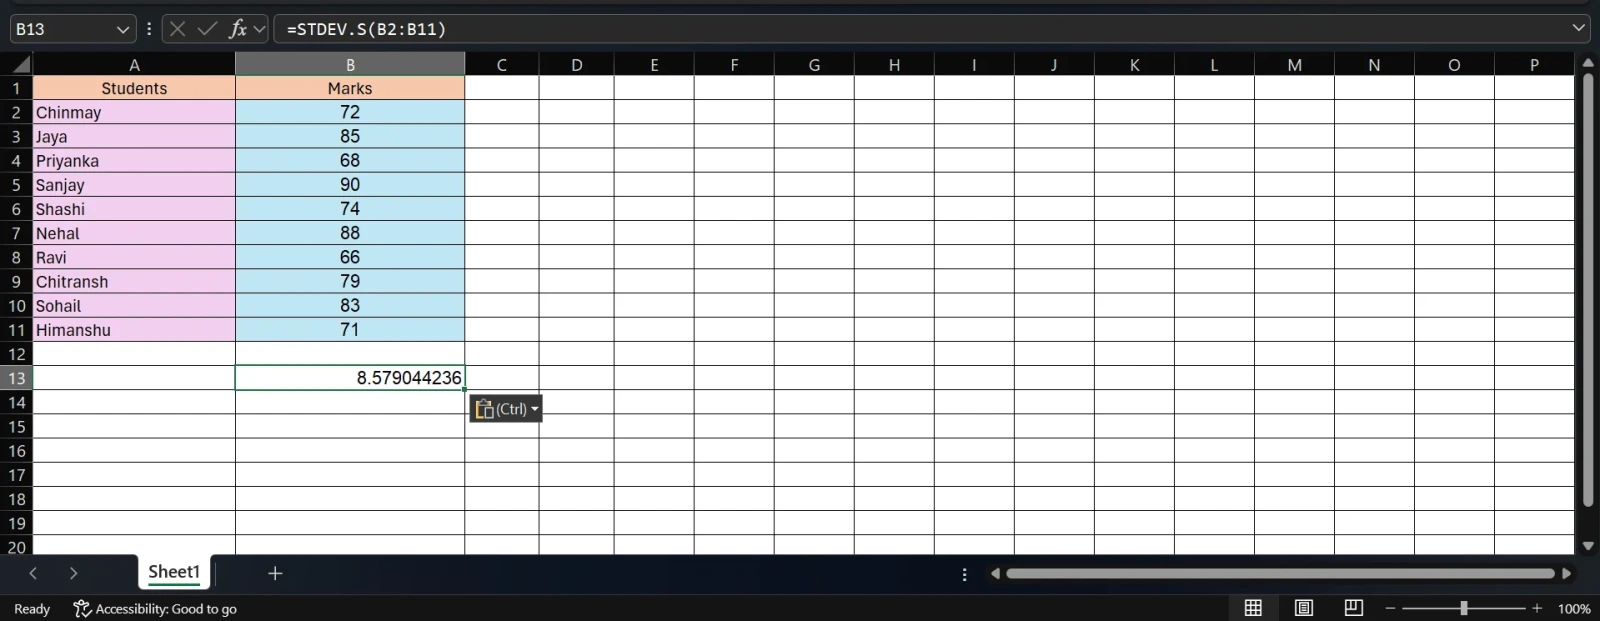
Calculate the standard deviation:
| Formula |
=STDEV.S(B2:B11) |
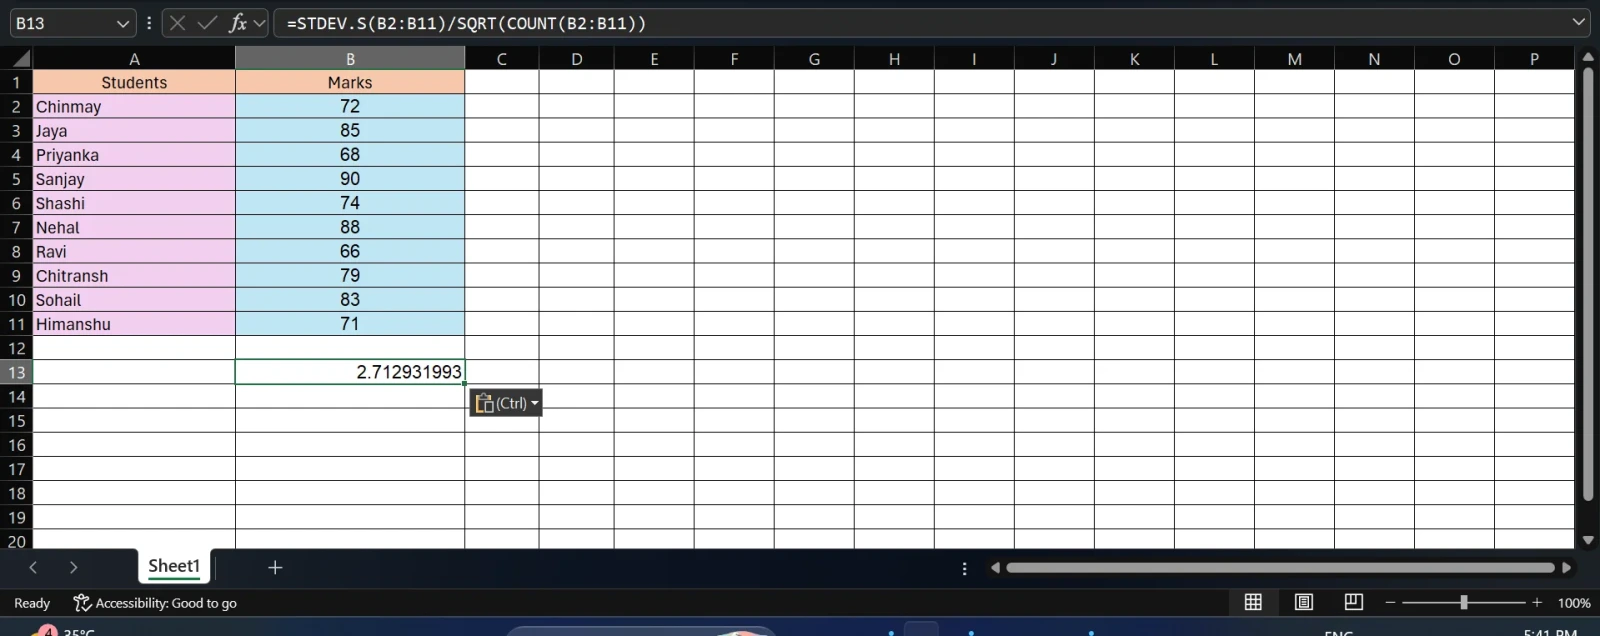
You can also calculate the standard error (standard deviation divided by the square root of n), which is useful in research and hypothesis testing:
| Formula |
=STDEV.S(B2:B11)/SQRT(COUNT(B2:B11)) |
If your data is organized into groups (for example, sales figures for three different regions), you can calculate standard deviation for each group separately.
Example setup:
| A (Region) | B (Sales) |
|---|---|
| North | 45000 |
| North | 52000 |
| South | 38000 |
| South | 41000 |
| East | 60000 |
| East | 57000 |
Rather than separate columns, use STDEV.S with IF as an array formula (Ctrl+Shift+Enter in older Excel, or just Enter in Excel 365):
| Formula |
=STDEV.IF(B2:B7, A2:A7, "North") |
Or in older Excel versions, use:
| Formula |
{=STDEV.S(IF(A2:A7="North", B2:B7))} |
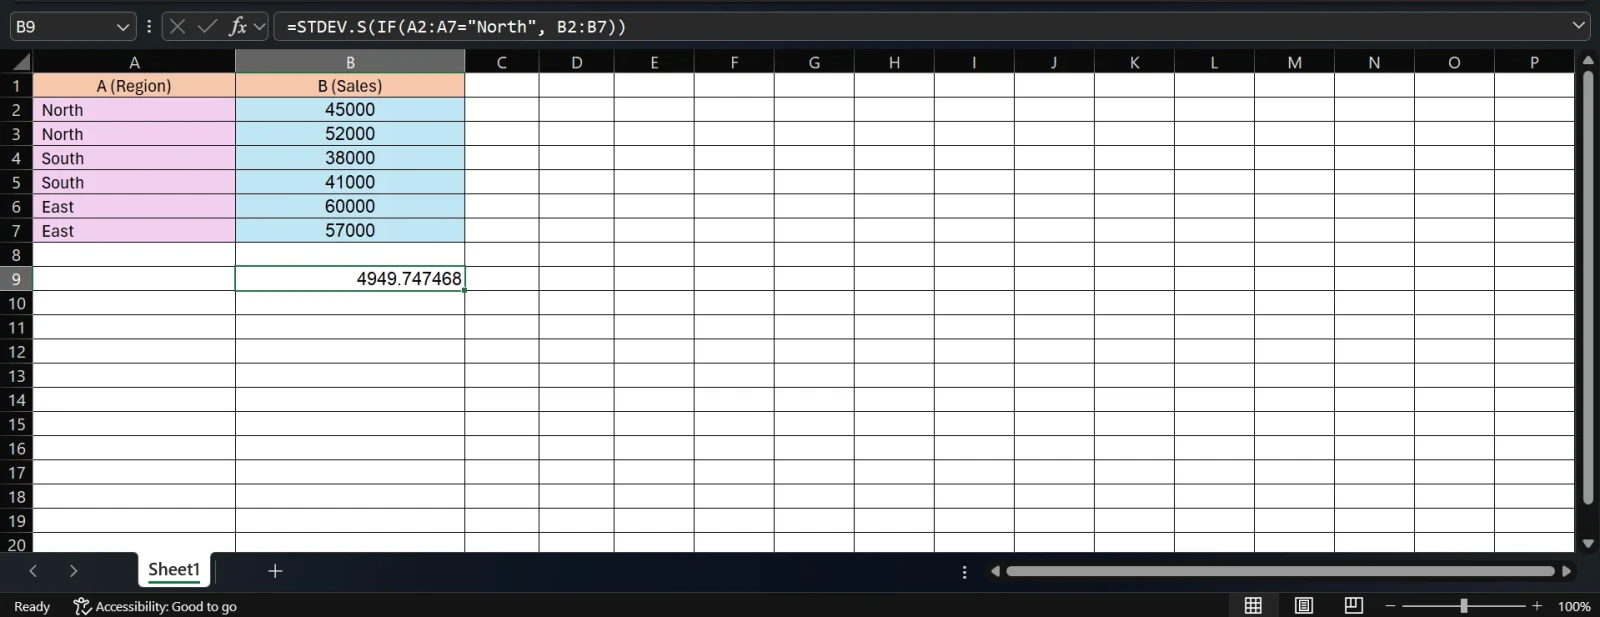
(Enter with Ctrl+Shift+Enter to activate the array formula.)
This returns the standard deviation only for the "North" region rows.
Also Read: CALCULATE Function in Power BI
One of the most visually impactful ways to present standard deviation is through error bars on a chart. This is common in research papers, dashboards, and scientific presentations.
Steps:
1. Create a chart (e.g., a bar or line chart) from your data.
2. Click on the chart to select it.
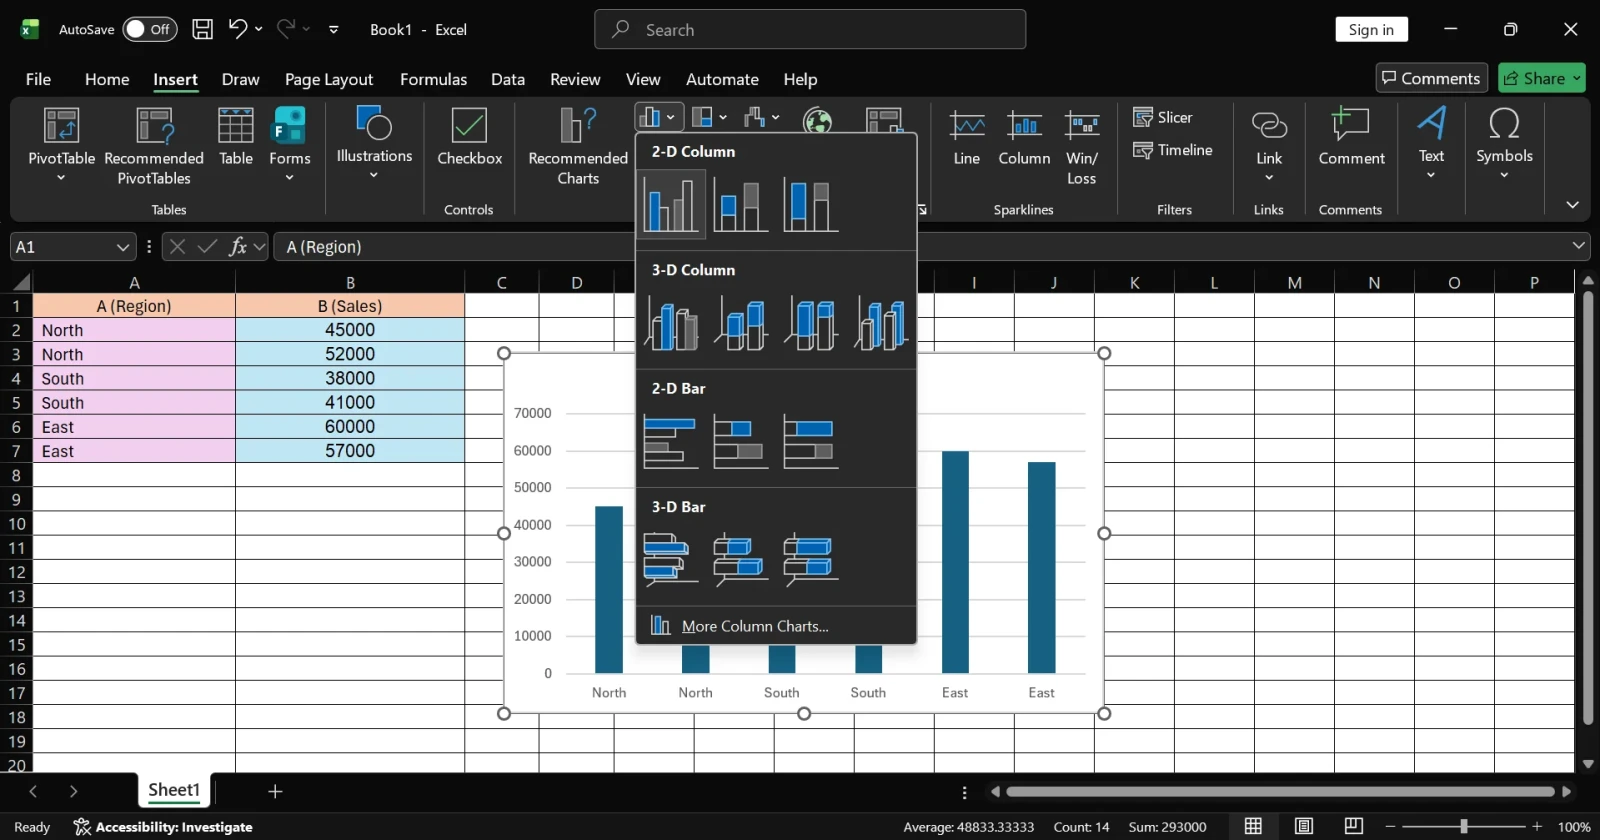
3. Click Chart Elements (the + icon on the right side of the chart).
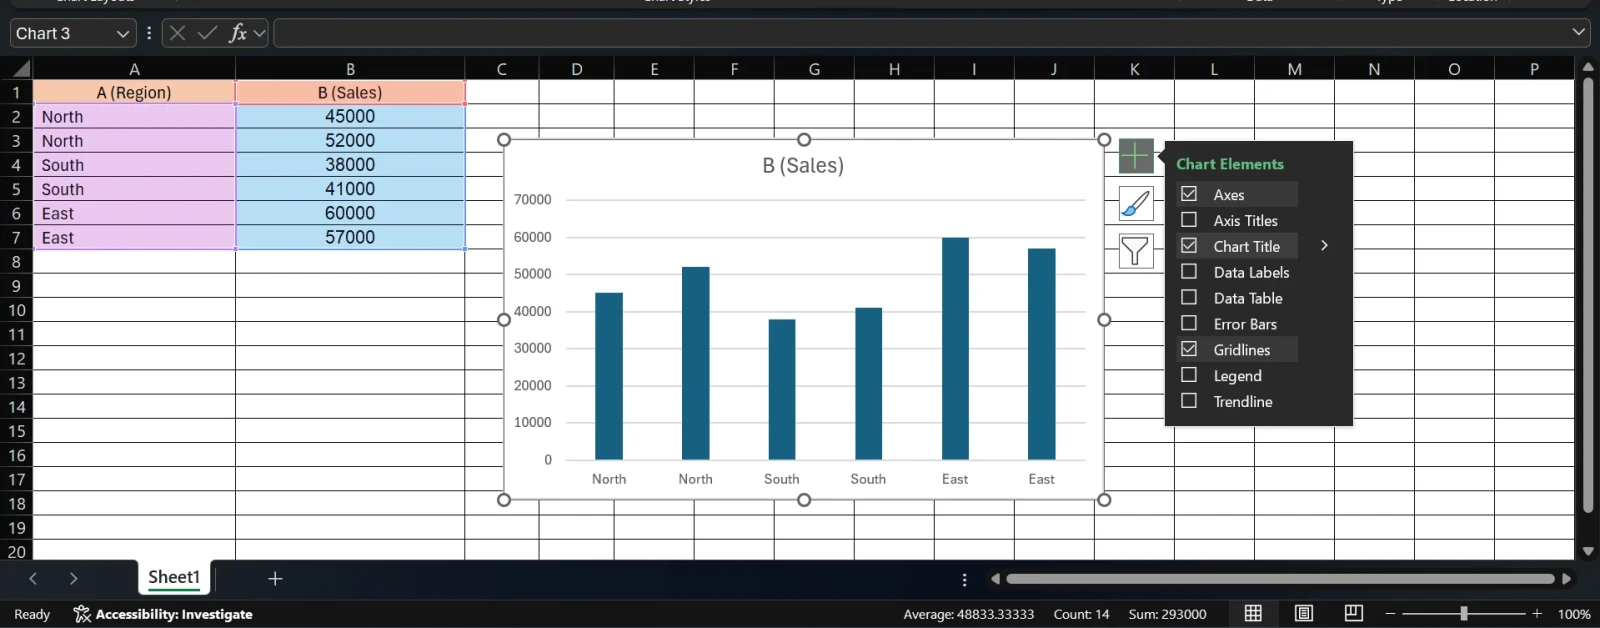
4. Check Error Bars → click the arrow → select More Options.
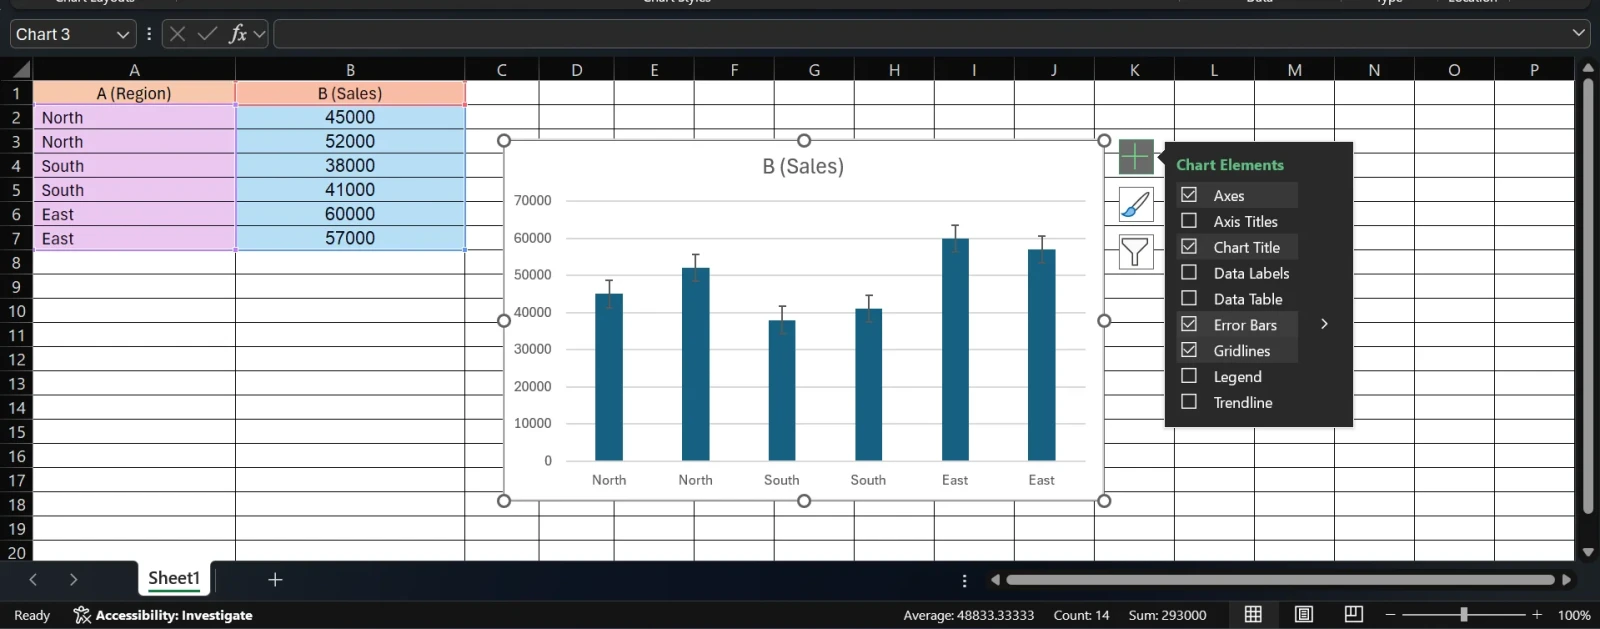
5. In the Format Error Bars panel, under Error Amount, select Custom → Specify Value.
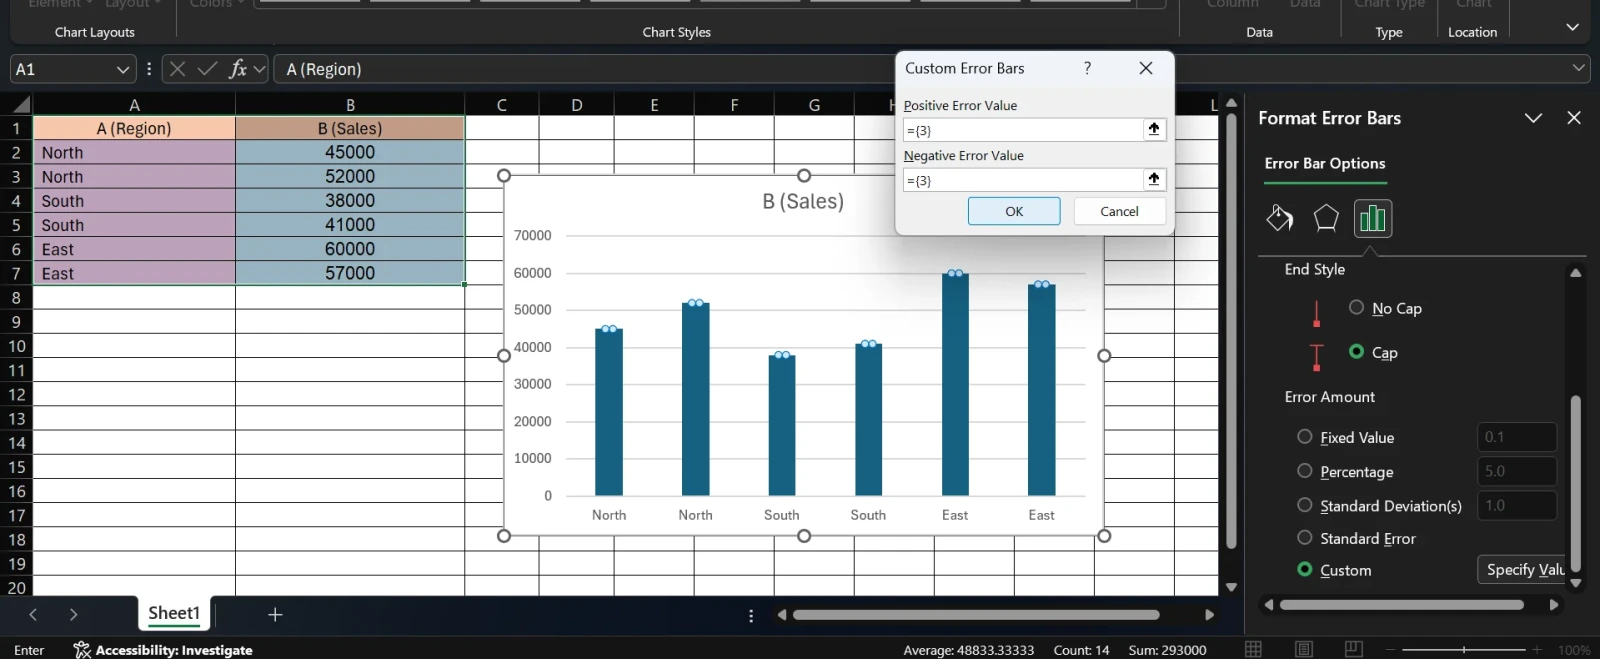
6. Enter your standard deviation range in both the "Positive Error Value" and "Negative Error Value" fields.
This adds visual markers showing how much variation exists around each data point.
Getting the number is only half the work. Interpreting it correctly is what makes your analysis useful.
Relative interpretation using the Coefficient of Variation (CV): Standard deviation alone can be misleading when comparing datasets with different scales. A standard deviation of 10 means something very different for a dataset averaging 15 vs. one averaging 10,000. The CV normalizes this:
| Formula |
=STDEV.S(B2:B11)/AVERAGE(B2:B11) |
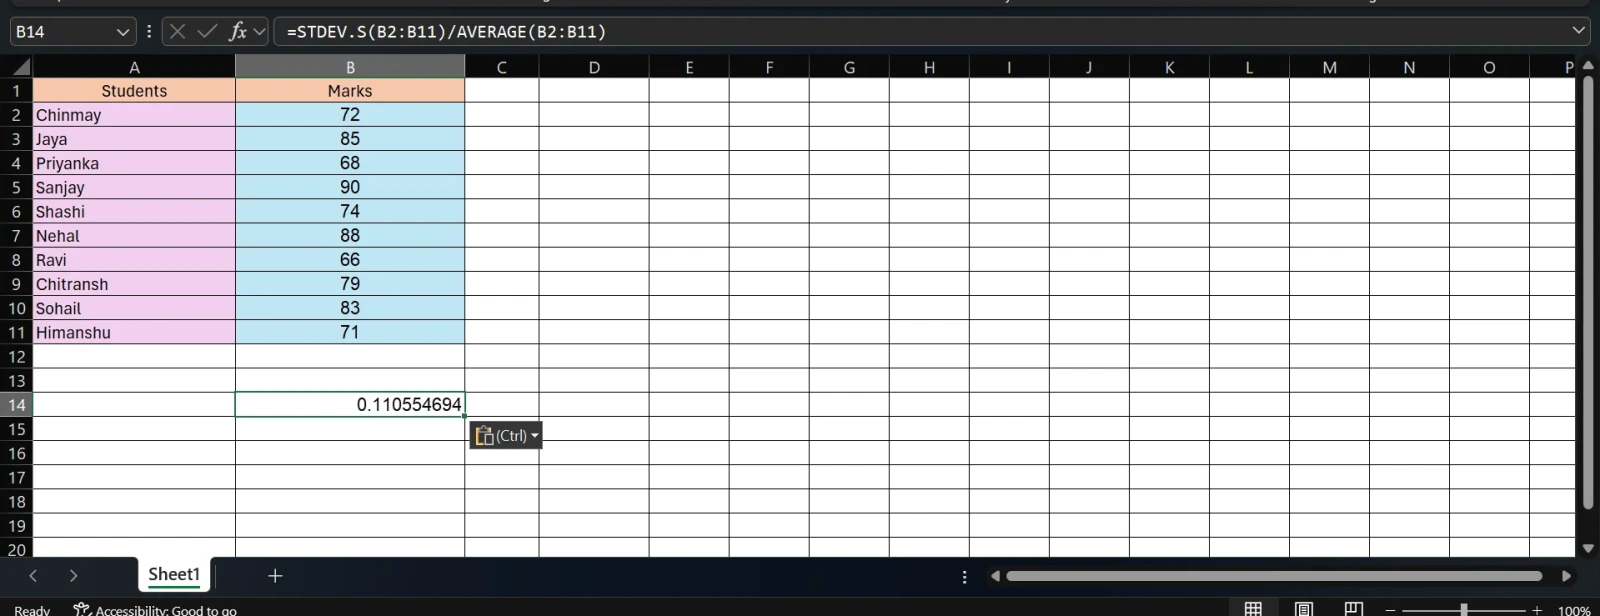
Multiply by 100 to express it as a percentage. A lower CV means less relative variability.
Related Article: Pivot Table in Excel
Here are some of common mistakes one need to know about before using the deviation methods. These mistakkes are generally done by beginners.
| Goal | Formula |
|---|---|
| Sample standard deviation (numbers only) | =STDEV.S(range) |
| Population standard deviation (numbers only) | =STDEV.P(range) |
| Sample std dev (includes text/logical) | =STDEVA(range) |
| Population std dev (includes text/logical) | =STDEVPA(range) |
| Standard error of the mean | =STDEV.S(range)/SQRT(COUNT(range)) |
| Coefficient of variation | =STDEV.S(range)/AVERAGE(range) |
| Variance (sample) | =VAR.S(range) |
| Variance (population) | =VAR.P(range) |
Also Read: KPI in Power BI: Key Performance Indicators Dashboards
Let's put this to work with a realistic scenario.
Dataset: Monthly performance scores for 8 employees.
| A (Employee) | B (Score) |
|---|---|
| Anil Sharma | 82 |
| Priya Mehta | 91 |
| Rahul Verma | 74 |
| Sneha Joshi | 88 |
| Karan Singh | 65 |
| Neha Gupta | 79 |
| Amit Patel | 93 |
| Deepika Roy | 70 |
| Formula |
=AVERAGE(B2:B9) |
Result: 80.25
| Formula |
=STDEV.S(B2:B9) |
Result: 10.13
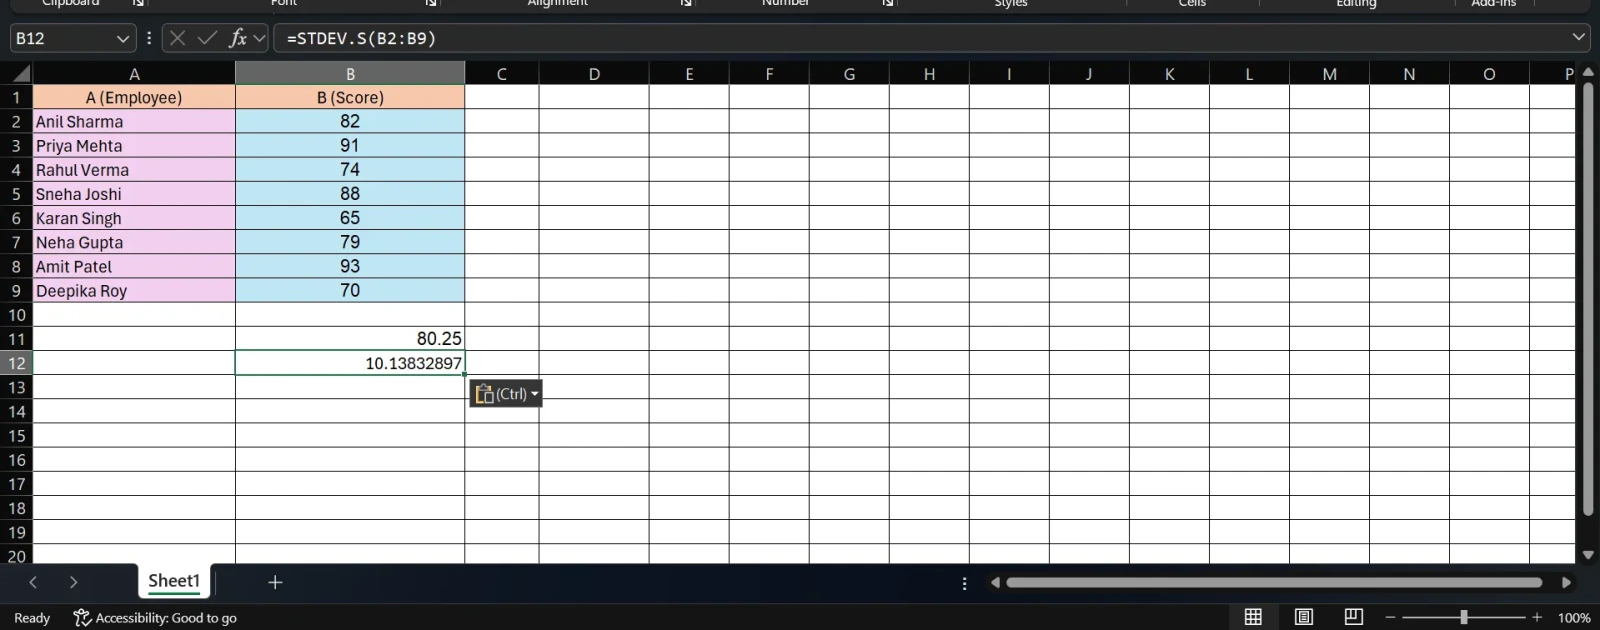
Interpretation: Performance scores vary by roughly 10 points from the average of 80. Karan (65) and Amit (93) are the furthest outliers. This tells a manager that team performance is moderately inconsistent and may warrant individual coaching.
Read Also: How to Calculate Age in Excel?
Once you understand standard deviation, these connected topics will deepen your analytical ability in Excel:
Read Also: Subtraction Formulas in Excel
Finding standard deviation in Excel is a two-step process: pick the right function (STDEV.S for samples, STDEV.P for full populations) and apply it to your data range. That single formula gives you a powerful measure of variability that supports better decisions in data analysis, research, finance, HR, and beyond.
The key is understanding what the number means, not just how to get it. A standard deviation that is high or low only makes sense in context, relative to your mean and the nature of your data.
Select an empty cell, type =STDEV.S( then highlight your data range and press Enter. This is the most common formula for sample data and works instantly on any numeric dataset.
STDEV.S is for sample data (a subset of a larger population) and is divided by n-1. STDEV.P is for a complete population dataset and divides by n. For most practical analyses involving surveys, research, or business data, STDEV.S is the right choice.
Yes, using STDEVA (sample) or STDEVPA (population). These functions treat text as 0, TRUE as 1, and FALSE as 0. However, use this only when including those values is statistically meaningful.
Common causes include: the range contains text that STDEV.S cannot process (switch to STDEVA), all cells in the range are empty, or fewer than two values are present (standard deviation requires at least two data points).
Use an array formula with IF: {=STDEV.S(IF(A2:A20="GroupName", B2:B20))}, entered with Ctrl+Shift+Enter in older Excel versions.
Yes. Standard deviation measures variability within a dataset. Standard error measures how much the sample mean is likely to vary from the true population mean. In Excel: =STDEV.S(range)/SQRT(COUNT(range)).
Yes. Excel's STDEV functions work efficiently on datasets with thousands of rows. For very large datasets or automated workflows that refresh regularly, consider combining Excel with Power Query or using Python for statistical analysis.