If you work with data regularly, you already know that most datasets are never clean, organized, or ready for analysis. They come with missing values, extra columns, inconsistent formats, and scattered files. And, fixing all of this manually can be frustrating and time-consuming. This is exactly where Power Query becomes extremely useful.
Basically, Power Query is a data connection and transformation tool developed by Microsoft. It helps you import, clean, reshape, and combine data from multiple sources in a simple and structured way. It is available in Excel and Power BI and is widely used for performing ETL (extract, transform, and load) operations without requiring complex coding skills. Instead of repeating manual steps again and again, you can define your transformations once and refresh them whenever new data arrives.
As a data analyst, I use Power Query very frequently in my projects to accomplish crucial tasks such as creating monthly sales reports, cleaning exported ERP files, and preparing raw data for dashboards. And you know it saves a significant amount of time. Once the transformation steps are set, I just click refresh and everything updates automatically. That level of automation makes a big difference in real-world workflows.
In this article, I will explain what Power Query is, how it works, practical examples of using it, its benefits and limitations, and how it compares with other Microsoft tools.
Let’s start with the introduction of Power Query.
Explore all Microsoft Certification Courses by igmGuru and choose the best one that meets your profile.
Power Query, first introduced in 2010 as Data Explorer, is a powerful data preparation and transformation tool by Microsoft that helps users shape raw data into a structured format suitable for analysis. It provides an easy-to-use graphical interface that allows you to connect to various data sources without complex coding. Once the data is imported, the Power Query Editor enables you to clean, modify, and transform the data step by step according to your requirements.
The use of Power Query is very specific; it allows you to clean, integrate, transform, etc., to make data ready for analysis. Here is the table explaining what Power Query is used for.
| Use Case | What Power Query Helps You Do |
|---|---|
| Data Cleaning | Power Query helps you clean messy datasets by removing duplicates, fixing incorrect values, handling missing data, and standardizing formats. This makes the data more accurate and ready for analysis. |
| Data Integration | It allows you to combine data from different sources such as Excel files, databases, web pages, or cloud platforms into one unified dataset for easier analysis. |
| Data Transformation | Power Query provides many transformation options that help you reshape data. You can split columns, merge tables, change data types, transpose rows and columns, and apply calculations to organize the data properly. |
| Data Enrichment | You can enhance your dataset by creating new columns from existing data or by bringing additional information from external sources such as web queries. |
| Data Shaping | Power Query helps you restructure data into the format you need. For example, you can pivot or unpivot tables, group rows, or reorganize the layout for better reporting. |
| Data Preparation for Reporting | Once the data is cleaned and transformed, Power Query loads it into Excel or Power BI where it can be used to create reports, dashboards, and visualizations. |
Power Query is already built into Microsoft Excel 2016 and later versions, including Office 365. You do not need to install anything separately.
If You Are Using Excel 2016 or Later
1. Open Excel.
2. Go to the Data tab in the ribbon.
3. Look for the Get & Transform Data section.
4. Click Get Data to start using Power Query.
You can also open the Power Query Editor by importing any data source like an Excel file or CSV file.
If You Are Using Excel 2010 or Excel 2013
Power Query is not built-in for these versions. You need to download and install it as an add-in. Before installing, you must check whether your Excel is 32-bit or 64-bit.
To Check Excel Version (Excel 2010)
To Check Excel Version (Excel 2013)
After checking the version, download the correct Power Query add-in (32-bit or 64-bit) and install it. Once installed, you will see a new Power Query tab in Excel.
Preparing data for analysis usually involves multiple repetitive steps such as importing files, removing unnecessary columns, fixing formats, and combining datasets. And doing all of this manually can be frustrating, time-consuming, and error-prone. Power Query simplifies this entire process by allowing you to perform these tasks through a structured workflow. Once you define the steps, Power Query remembers them and applies them automatically whenever the data is refreshed. Let’s understand how Power Query works.
There are four key stages in the working of Power Query:
Power Query starts by connecting to your data source. The data source can be Excel files, CSV files, databases like SQL Server and online services like SharePoint or Salesforce. You can simply select the source, and Power Query will establish a link to fetch the raw data.
When the data is once connected, Power Query loads the data into a preview window known as the Power Query Editor. In this preview Window you can shape your data according to your needs. You can remove columns, filter rows, change data types, merge tables, pivot/unpivot data, split columns, and much more. It records each transformation when you apply it step by step in the background. For doing this Power Query uses a scripting language called M language (or M Code).
In this step, you can combine multiple data sources. For instance, if you want to append monthly sales files from January to December into a single unified table or if two tables share a common field, you can merge them to create a more complete dataset.
By this step, your data will be transformed and ready then, Power Query loads it into Excel or Power BI. Here you have a choice to load it directly into a worksheet or into the data model for further analysis. You can do it by using PivotTables, dashboards, or visualizations.
There is one more step named as Automation (optional). This is recognized as one of the biggest strengths of Power Query. Once you have defined your steps, you can refresh your data with just one click. After that Power Query will reapply all the transformations to the new or updated data automatically.
Both of these tools are products of Microsoft, which differ in their functionalities. Power Query is a data extraction and processing tool, whereas Power BI is known for its visualization capabilities. Power BI integrates with Power Query and uses its data to create different types of visuals. Here are some of the common differences between them -
| Features | Power Query | Power BI |
|---|---|---|
Primary Function | Data transformation and preparation (ETL: Extract, Transform, Load). | Business analytics and data visualization |
Scope | A data transformation tool. | A comprehensive business intelligence platform. |
Purpose | To clean, shape and combine data from different sources. | To visualize data, create reports and dashboards, and share insights. |
Availability | Integrated into Power BI Desktop and Excel | A desktop application (Power BI Desktop) and a cloud-based service (Power BI Service) |
Key Actions | Connecting to data sources, cleaning data, transforming data and reshaping data. | Creating visualizations, building data models, designing reports, publishing dashboards and sharing insights. |
Output | Transformed and cleaned data sets. | Interactive reports, dashboards and visualizations. |
Role in Data Analysis | Data preparation stage. | Data analysis and presentation stage. |
Relationship | Is a component within Power BI. | Power BI uses Power Query as a data preparation tool. |
Data focus | Data transformation | Data visualization and report creation |
Related Article - How to Use Power Query in Excel?
Power Pivot is also a data modeling tool like Power Query but it has some different functionalities too. These are processing data, establishing relationships, building complicated calculations and extracting meaningful insights from datasets. Here are some of the common differences between these tools -
| Features | Power Query | Power Pivot |
|---|---|---|
Primary Purpose | Data extraction, transformation and loading (ETL) | Data modeling and analysis |
Core Functionality | Connecting to data sources, cleaning, shaping, and transforming data. | Creating data models, establishing relationships and performing advanced calculations. |
Typical Actions | Importing data from various sources, removing duplicates, changing data types, merging columns and appending queries. | Creating relationships between tables, defining calculated columns and measures, analyzing large datasets. |
Language Used | M (Formula Language) | DAX (Data Analysis Expressions) |
Data Manipulation | Data transformation and preparation. | Data analysis and relationship building. |
Output | Clean and transformed data tables. | Data models for analysis in PivotTables, Pivot Charts and Power BI. |
Data handling | Focuses on rows of data, and transforming them. | Focuses on modeling data, and relationships between tables. |
There are many benefits of Power Query in data analysis and preparation. All these benefits and other aspects make it a useful tool for analysts. Some of the main benefits that one cannot simply ignore are
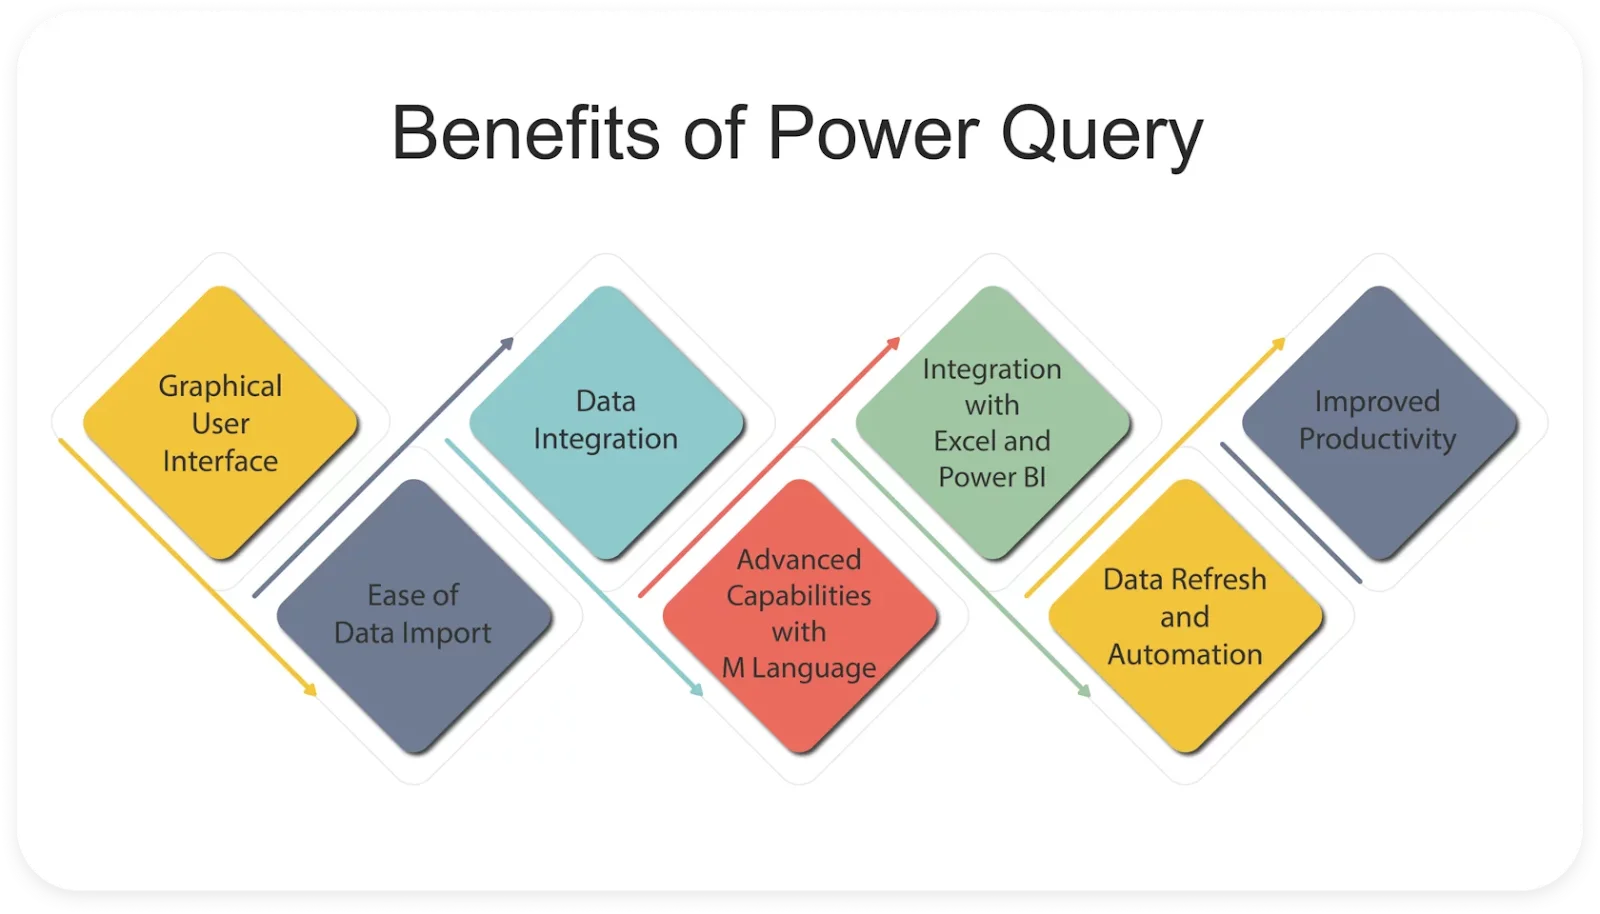
It has an intuitive graphical user interface. Individuals can use a GUI without having extensive programming knowledge. Anyone can interactively create and customize data transformation steps.
This data transformation tool automates data importing from different sources, including databases, web pages, files and clouds. This means there is no need for manual data entry like copy and past.
It can connect with many types of data sources to extract information from them. It combines all this information into a single dataset that gives reporting and analysis across diverse databases.
M is the main programming language used in this data modeling tool. It gives many data manipulation capabilities like complicated data transformations. These transformations include grouping, aggregation, pivoting, unpivoting, merging, error handling, etc.
This tool can smoothly integrate with Excel and Power BI. This integration gives the capability to build dynamic reports and dashboards using its data.
Individuals can schedule automatic data refreshes on this tool. This way, they can make sure their analysis process is perfect and use the latest data. It is the best approach for dynamic data sources.
The task automation capabilities of this tool save time and effort for analysts. This way, they can do the same work in less time to focus on more important tasks like analysis and decision-making.
Read Also- Excel Interview Questions
Like any tool, Power Query also has its limitations and drawbacks.
Explore the top Power BI Dashboard Examples.
Understanding Power Query becomes much easier when you see how it works in a practical situation. In most real-world scenarios, data is not ready for analysis immediately. It usually needs cleaning, formatting, and restructuring. Power Query helps perform all these tasks in a structured and repeatable way.
Let’s take a simple example to understand how it works.
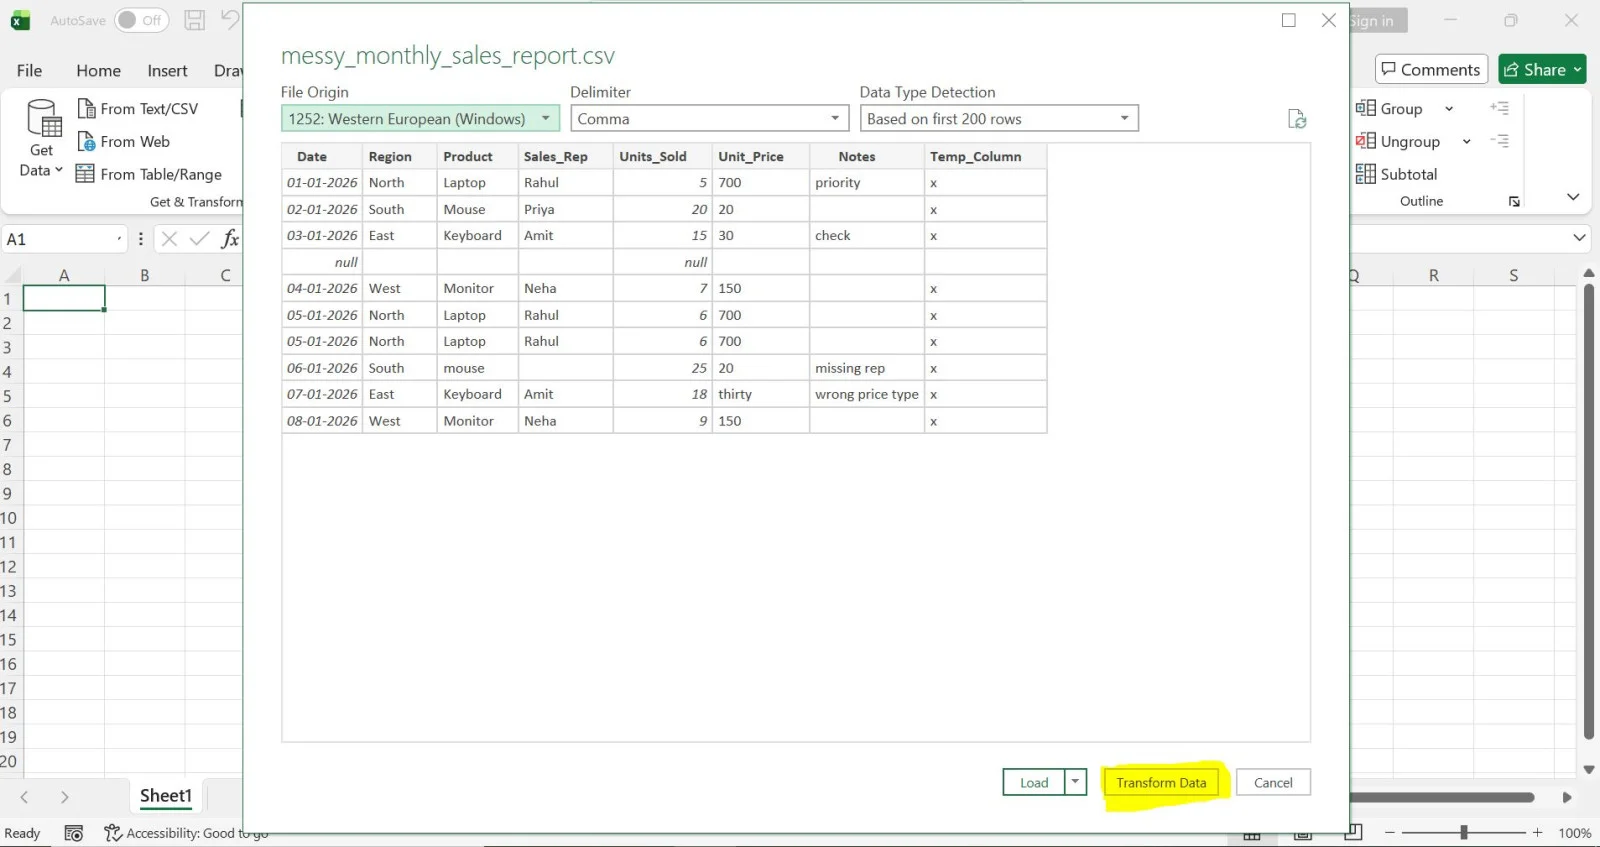
Suppose you receive a monthly sales report in a CSV file. The file contains some common issues such as extra columns, blank rows, and incorrect data formats. Instead of fixing these problems manually every month, you can use Power Query to automate the process.
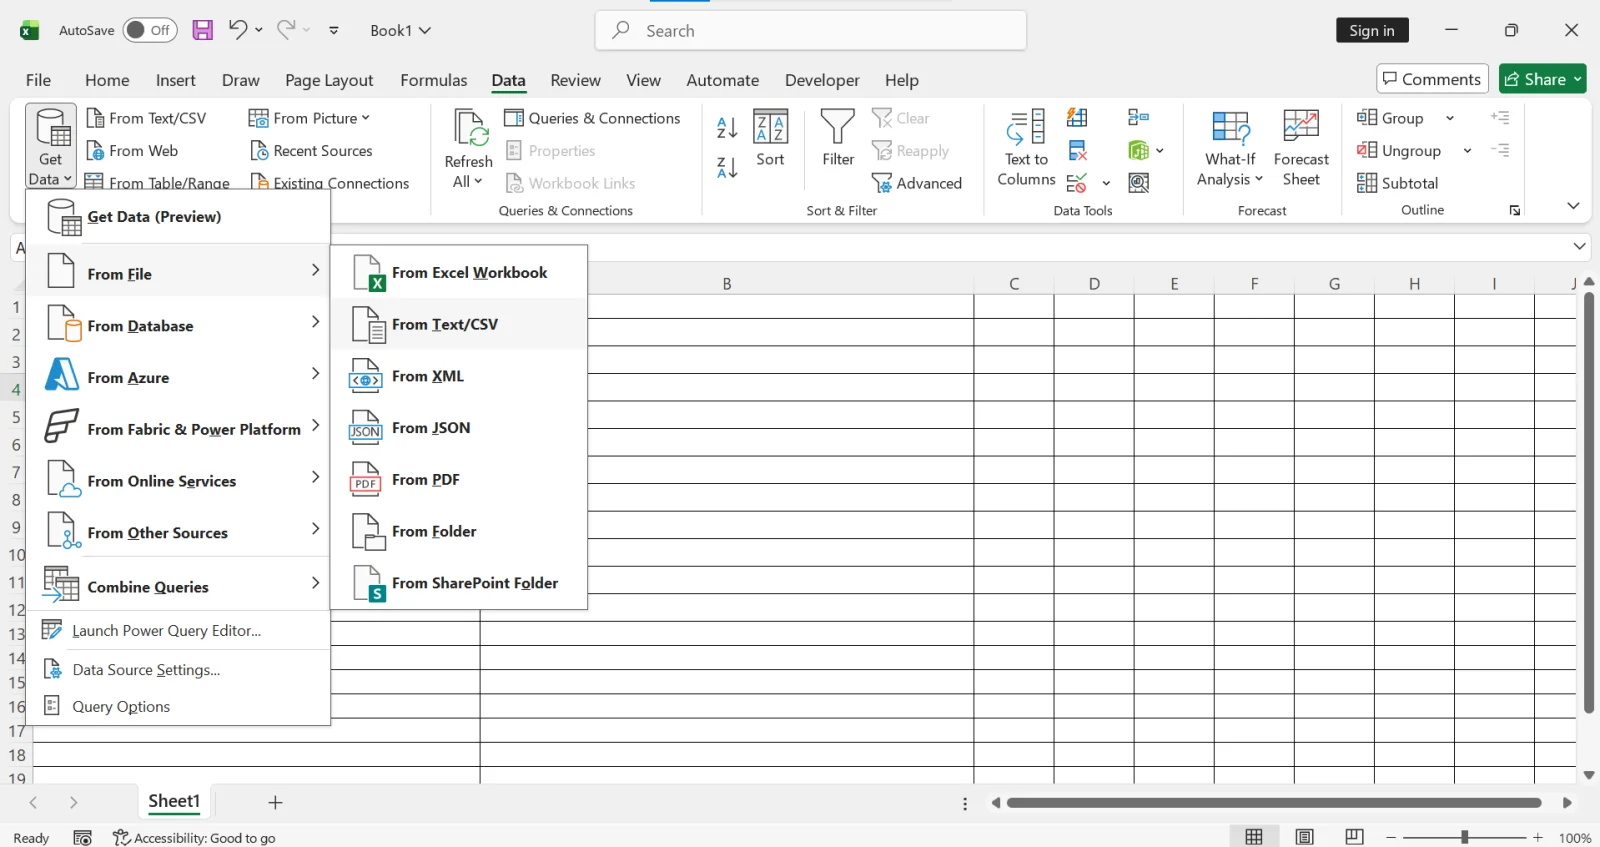
First, open Excel and go to the Data tab.
Click Get Data → From File → From Text/CSV, and select the CSV file that contains the sales data.
Excel will show a preview of the data. From there, choose Transform Data to open the Power Query Editor.
Next, you can reshape the dataset according to your needs.
For example, you can:
These transformations help make the dataset more useful for analysis.
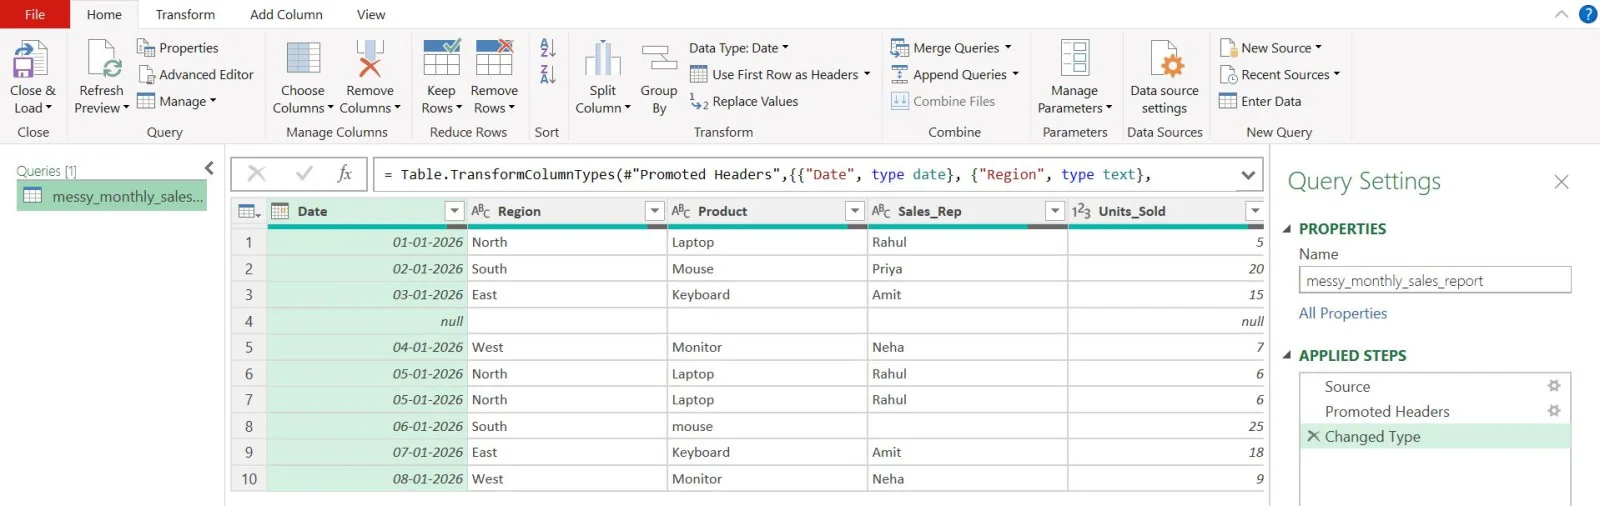
Inside the Power Query Editor, you can start preparing the data.
You might perform actions such as:
Each action you perform is recorded automatically as a step.

After the data is cleaned and structured, click Close & Load.
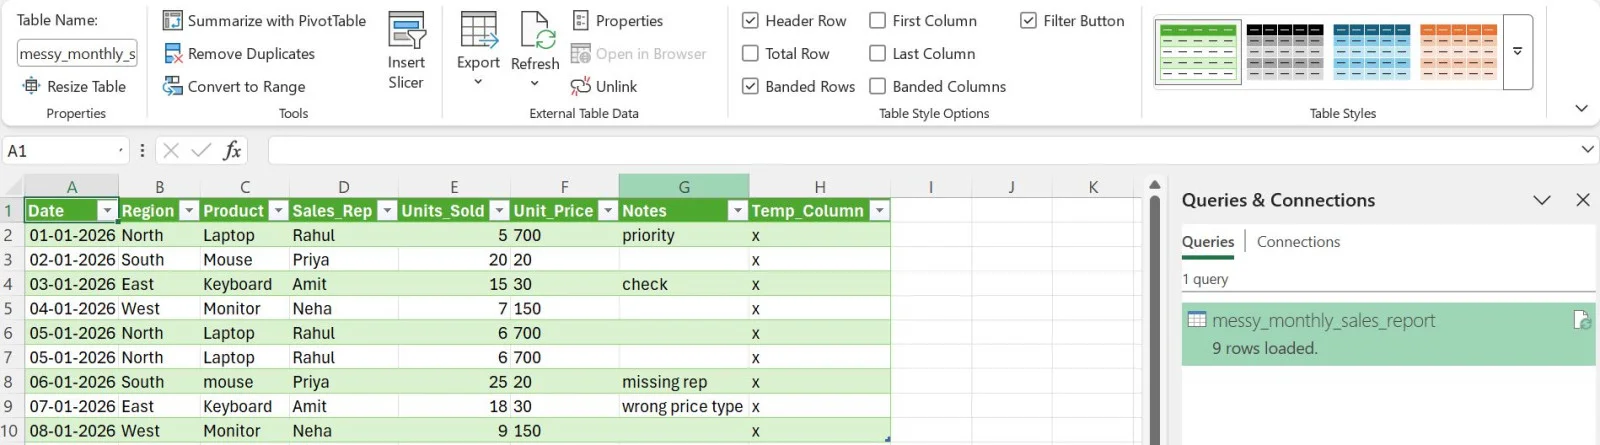
Power Query will load the processed dataset into Excel as a new table. You can now use this clean data to create PivotTables, charts, or dashboards.
One of the biggest advantages of Power Query is that the entire process becomes automated.
When you receive a new sales file next month, you do not need to repeat the steps. Simply replace the source file and click Refresh. Power Query will automatically apply all the transformation steps again and update the results.
Power Query has become a more versatile data extraction and preparation solution these days. Its graphical GUI feature gives many robust capabilities like complicated data manipulation. This also makes it accessible to each level of the audience. It can smoothly integrate with Excel and Power BI, which unlocks many more capabilities. Data analysts, financial analysts or business systems analysts typically use this tool to streamline their workflows.
Both of these are indeed different tools but closely related to each other. Power Query has now become an Excel tool that extracts data from different sources and imports it into Excel sheets. It does different operations on the same information for further processing.
Learning how to use this type of data transaction tool is very simple. It has an easy-to-understand user interface and different automation capabilities. Anyone can learn it easily as there is no requirement to perform sophisticated tasks due to its automation capabilities.
It is a Microsoft product and that itself makes it popular among many experts. We have already discussed some of them in this article. This means it is a good skill to have for individuals who want to start a career in this area.
Course Schedule
| Course Name | Batch Type | Details |
| Advanced Excel Training | Every Weekday | View Details |
| Advanced Excel Training | Every Weekend | View Details |


Advantages And Disadvantages of Artificial Intelligence (AI)
June 25th, 2026