'What is data analysis' is quite a commonly asked question these days. It is an extensive method of cleansing, inspecting, modeling and transforming data for drawing conclusions, supporting decision making and discovering useful information. This multifaceted process encompasses different methodologies and techniques for interpreting data from different sources.
This article is a complete guide on 'what is data analysis' followed by its importance, process, types, applications, tools and a lot more. There are many questions one might have with regards to this methodology and a lot of those have been answered here.
Data analysis is the process that includes examining, adapting, modeling and filtering data to solve many different problems. This process determines whether something is working for the company or not. Changes are consequently made to the strategy for achieving business goals.
It is about analyzing quantitative data (like profits and sales) as well as qualitative data (like surveys and case studies). The purpose is to paint the complete picture with everything at hand. Let's take a look at the impotence of data analysis in 2026.
Get started on your way to becoming a Data Analyst by starting our advanced Tableau training program.
The world is in the middle of a digital transformation where data analysis has become an important aspect. The gigantic quantities of data generated by digital technologies has snowballed into big data. Once this magnanimous data is analyzed correctly it brings invaluable insights to the table.
There is expected to be a huge surge in the market size for BI and analytics software applications. The movement forecasted is a surge from 15.3 billion USD in 2021 to over 18 billion in 2026. This process unlocks all the potential that big data holds with respect to making sense of it all for turning it into highly actionable insights.
The data analysis process to be followed in 2026 is not much different than the one that's being followed now. There is very little to no difference as of yet. Here is what the process looks life -
The very first step in this process is defining the objectives and formulating clear as well as specific questions that the analysis answers. This step sets the direction for the complete process that is yet to follow. It encompasses understanding the problem at hand, then deducting the data that will address it and finally defining the indicators or metrics for measuring the outcomes.
The next step after defining the questions and objectives is collecting the needed data. This is often done through different methods like interviews, surveys or observations. Data can also be extracted from existing databases and can be quantitative or qualitative.
Data cleaning is another important step in this process. Here the data is checked for any inconsistencies or errors and these are then corrected or removed. This step keeps the quality and reliability level of the data high for meaningful and accurate analysis results.
Actual analysis begins after the data is cleaned. Statistical or mathematical techniques are applied to the data for discovering relationships, trends or patterns. Many different software and tools are available for this purpose. The list has many names like R, Python, Excel and other specialized software (like SAS and SPSS).
Analyzing the data leads to the next step that is about interpreting the results and visualizing it for easy understanding. This could include creating graphs, charts or some other visual representations for this data. Data visualization makes complicated data more understandable though a clear picture of the findings.
The last one is data storytelling for presenting the analysis findings in a narrative form for better engagement and ease of understanding. This step effectively communicates the results to non-technical audiences.
Relaed Article- How To Become A Data Analyst
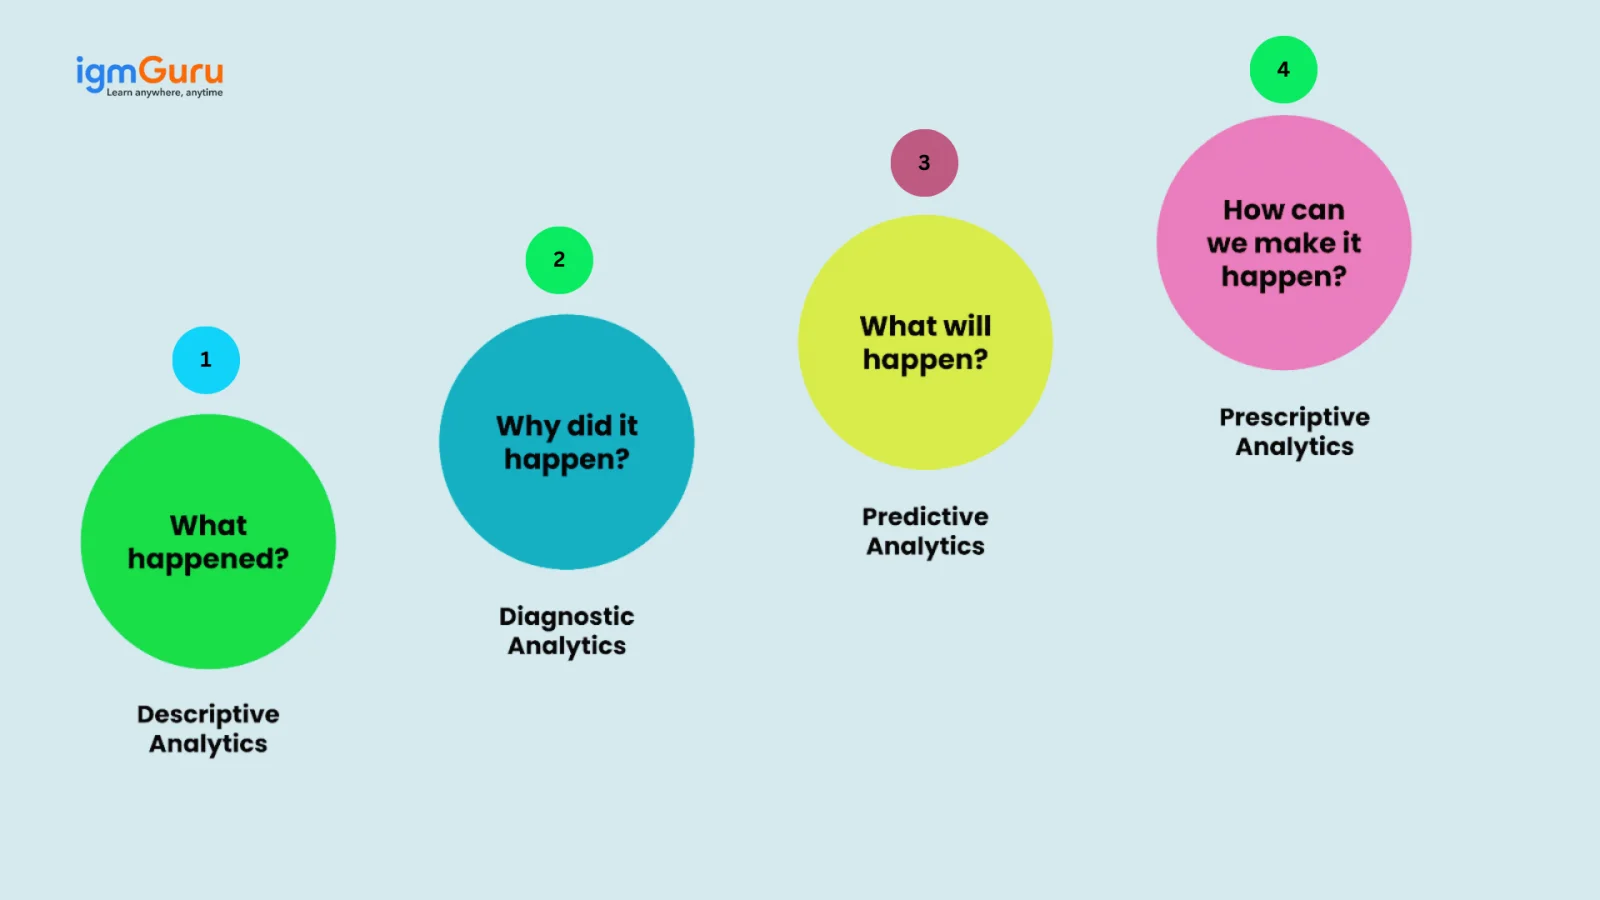
There are four different types of data analysis that can help the aspirant completely understand this process. Every single type has some significance that it brings forth. Let's take a look at them individually for better understanding.
Descriptive analysis summarizes or describes raw data for more interpretability. It encompasses analyzing historical data for understanding the events of the past. Trends and patterns happening over time are identified. A business may use descriptive analysis for understanding the average monthly sales occurring for the past year.
Diagnostic analysis is a step ahead of descriptive analysis and determines the reason behind something happening. It encompasses a more detailed data exploration and also compares different data sets for understanding the cause of a given outcome. A company whose sales are dropping in a particular month can use diagnostic analysis to find out the reason.
Predictive analysis is about using forecasting techniques and statistical models for understanding the future. It encompasses using past data for predicting the possibilities that lie in the future. This analysis is useful mainly for risk assessment, sales forecasting and marketing. A company might use this analysis for forecasting the next quarter's sales according to their historical data.
Prescriptive analysis is highest on the list and the most advanced type of analysis. It predicts future outcomes while also suggesting the actions that will prove to be beneficial from these predictions. Many sophisticated technologies and tools like artificial intelligence and machine learning are used for recommending decisions. A prescriptive analysis might put forth the best marketing strategies one can implement for increasing future sales.
Related Article- Data Analytics Tutorial for Beginners
The expanding use of data has led to many new applications of data analysis. Different industries have found different use cases for this process and implement it for many benefits. The most common applications are discussed here.
Data analytics solves traffic congestion and makes traveling experience smoother by making transportation intelligence and systems better. It works by extracting gigantic data volumes for building alternative routes and solving traffic congestion. This reduces traffic congestion and road accidents in turn.
Travel companies these days obtain their buyers' preferences through social media (and other sources) for more personalized packages. Buyers get better travel experiences and improve the company's customer base.
Search engines like Google, Bing and others use analytics for arranging data and delivering the best search results. This reflects that data analytics is commonly used in different search engine operations. Data analytics accumulates gigantic data volumes (when storing web data) that are submitted by different groups and pages. Analytics also helps web pages to rank according to relevance.
Every word entered by the searcher acts as a keyword for delivering search results. Data analytics is again made use of for searching a particular set of web pages. These pages have words that match the keyword's intent best.
Policymakers can make learning curricula better with finer management decisions. These applications lead to better learning experiences and administrative management. The curriculum can be improved by collecting preference data from every student and building the curricula. This might create a better system where learners use different ways of learning the same knowledge.
Quality data collected from students helps in better allocation of resources and making sustainable management decisions. Admins can for instance know the facilities that students prefer less or even the subjects they are least interested in.
This process makes a productive workflow and leads to better delivery processes in this industry. This yields better industry performance and a broader customer base consequently. Productivity increases as real time data sharing between partners becomes a possibility. These insights cover the workforce's performance and fluctuations in customer demands.
Delivery process is improved as logistics companies do route optimization with data analytics. Companies can pick the best time and routes through Global Positioning System (GPS) data, road maintenance data, personal schedules and weather data.
Marketers understand the audience for high conversion rates with data analytics. There are many different activities included in these sub-applications too. Digital ad experts use analytics for understanding the audience and their likes, dislikes, gender, race, age and other features. This technology segments the audience according to preferences and behaviors. Identify trends and generate relevant content for more engagement to obtain better conversion rates.
Security personnel use this process for finding future cases of security breaches or crimes. They investigate ongoing or past attacks for analyzing the way IT systems were breached, end-user behavior and other plausible weaknesses. Some cities also monitor areas that reflect high crime rates. Crime patterns are monitored for predicting future crime possibilities.
Related Article- What is Data Science in Python
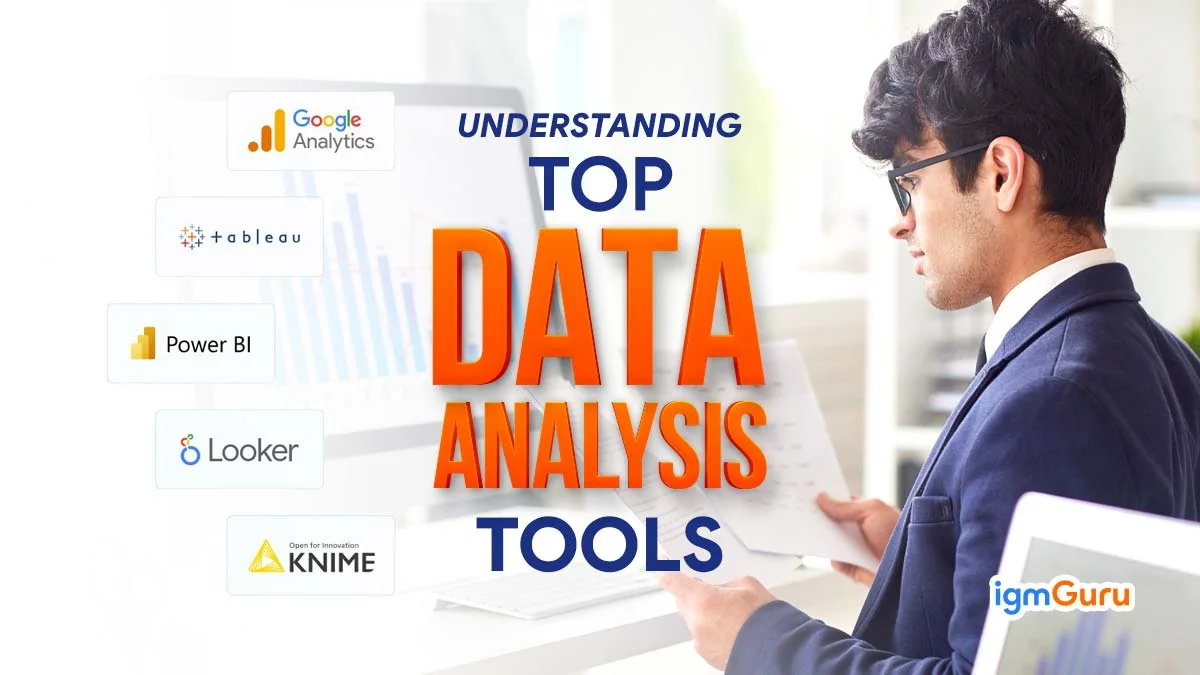
There are many different data analysis tools for varying levels of expertise, needs and complexities. These tools hop between programming languages (like R and Python) and visualization software (like Tableau and Power BI). Let's see some of these top tools.
This high level and general purpose programming language is a favorite amongst data scientist and analysts. It is simple and readable with many amazing libraries like NumPy, Matplotlib and pandas.
Structured Query Language is the standard known language for manipulating and managing databases. It retrieves and manipulates data that is stored in relational DBs.
This powerful data visualization tool is used heavily in the business intelligence industry. It creates shareable and interactive dashboards for depicting variations, density and trends in the form of graphs and charts.
This programming language has a free software environment that is specifically crafted for statistical graphics and computing. Statisticians and data miners love this tool for data analysis and developing statistical software. It has graphical and statistical techniques like time-series analysis, classical statistical tests, linear and nonlinear modeling and more.
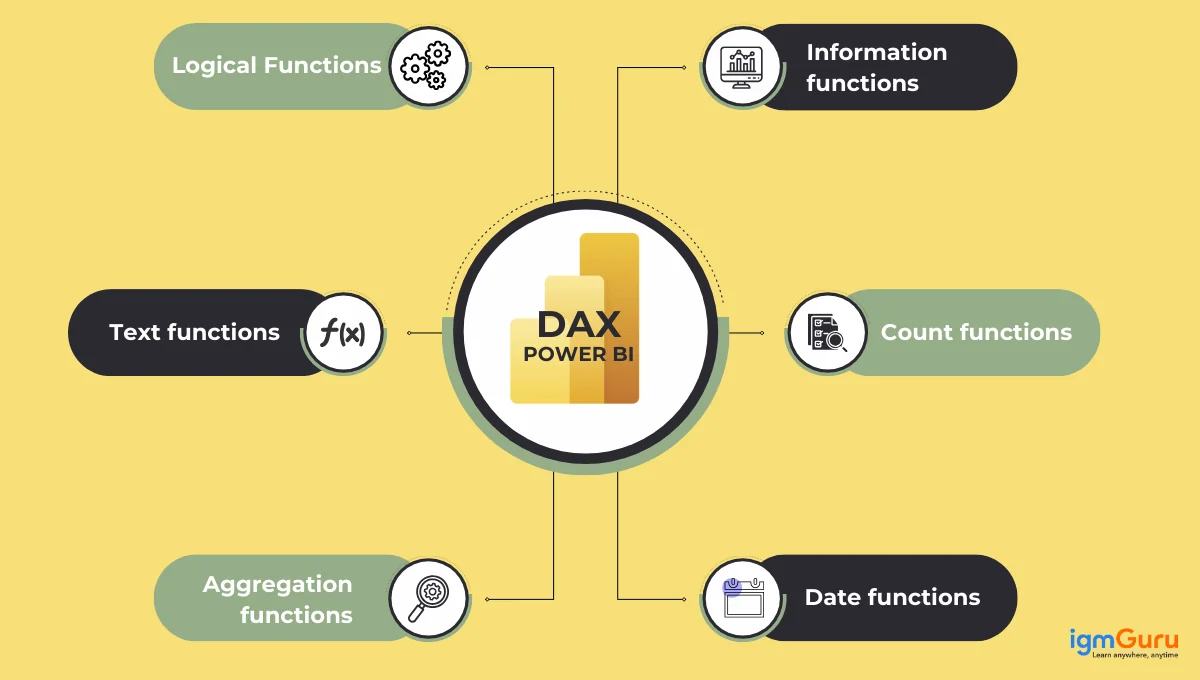
This business analytics tool is a Microsoft development and provides highly functioning interactive visualizations with self-service BI capabilities. It transforms raw data into very meaningful insights with its easily understandable reports and dashboards.
Microsoft Excel is amongst the most globally used tools for data analysis. Its features include statistical analysis, visualization and data manipulation.
Explore our Power BI training program to become pro in Data Analysis.
The future trends in data analytics have already begun to take shape. These trends usually start small and roll up into bigger impact-makers. Some of these that are expected to shine bright in the coming years too include -
AI-powered data analytics is already bringing about major changes in business operations around the globe. Artificial intelligence has a big role to play in data analytics and is improving human data handling abilities. These systems make faster and more flexible decisions as they adapt to change at a much faster rate than otherwise possible.
Such data analytics is trending because of dynamic and advanced algorithms. These assess data at many different scales and pave the path for different cases impossible to perform through traditional methods. AI algorithms have raised leads by 50% and the coming year will see around 100 million people working in the artificial intelligence space.
Data-centric artificial intelligence is the systematic sequence of data that is engineered for generating AI systems. It centers on applying, understanding and finally making decisions according to this data. The reliance here is not on algorithms but on data analytics and Machine Learning for learning from data.
Edge Computing is a huge array of networks and devices with the users. It collects data from many different devices through high-performance processing, secure platforms and low-latency connectivity. This is an upcoming computing paradigm wherein the data gets processed at the network's periphery instead of the center. It hence speeds up the data travel.
It moves data storage to its source or origin for easy data management. It also gives accurate data and consequently valuable insights for making better decisions.
Data fabric is a growing system that separates information from metadata. It then learns and accordingly takes actions for the future. It flags out the problems or opportunities with respect to data while offering suggestions about ways to overcome them. The outcome here is systematic management of data.
What is data analysis and what is its purpose can simply be answered in a line. This process includes transforming and polishing data for uncovering trends, anomalies and patterns. The outcome is further used for solving problems, making decisions and finally reaching all business goals.
It is much more than just stats and numbers but also concentrates on asking the right questions. This article here covers its importance in the growing tech space, processes it encompasses, its types and applications. A section is dedicated to understanding its future since it is still taking shape.
Data analysis is a process where individuals or tools take raw data and convert it into useful insights for decision making.
An instance of data analysis will be medical research where researchers take previous data and compare it to find new cures.
Data analysts collect raw data and perform different operations on it to find valuable insights. Decision making, forecasting and performance analysis are also their responsibilities.
Couse Schedule
| Course Name | Batch Type | Details |
| Business intelligence Courses | Every Weekday | View Details |
| Business intelligence Courses | Every Weekend | View Details |