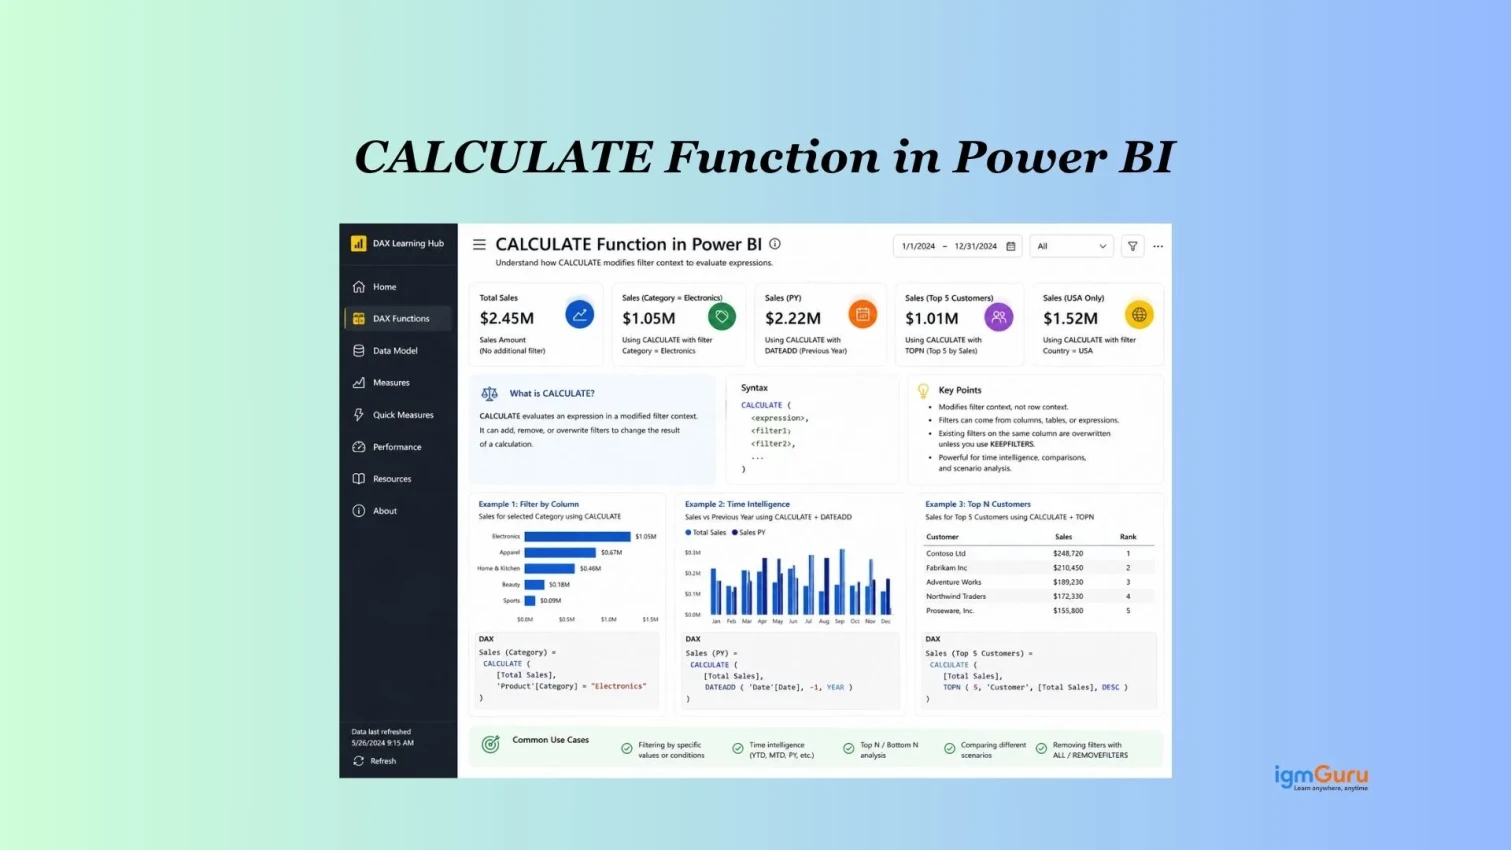
If you have spent any time building reports in Power BI, you have probably heard that the CALCULATE function is one of the most powerful tools in DAX. That is completely true. Once you understand how it works, your ability to build smart, flexible, and meaningful reports will jump to a whole new level.
This guide covers everything you need to know about the Power BI CALCULATE function, from the basic syntax to real-world use cases. Whether you are a beginner just getting started with DAX or a report builder looking to go deeper, this article has something for you.
Read Also: What is Microsoft Excel?
The CALCULATE function in Power BI is a DAX (Data Analysis Expressions) function that evaluates an expression inside a modified filter context. In simple terms, it lets you calculate a value while applying your own custom filters, regardless of the filters already active in the report.
Microsoft places CALCULATE in the Filter Functions category of DAX. It is arguably the most used and important DAX function in Power BI.
Here is why it matters
Power BI visuals always operate inside a filter context. When you place a table or chart on the canvas, Power BI automatically filters the data based on the rows, columns, slicers, and page-level filters in your report. The CALCULATE function lets you step outside that automatic context and define your own.
That ability is what makes CALCULATE so powerful. You can use it to compare a filtered value against a total, calculate year-over-year growth, build running totals, or filter for a specific segment without touching the report's visual filters at all.
Related Article: Introduction to Power BI Dashboard
Every function in DAX has a specific structure you need to follow, and CALCULATE is no different. The good news is that the syntax is clean and straightforward. Once you see it a few times, it becomes second nature.
The syntax for the Power BI CALCULATE function is:
CALCULATE( <expression>, [<filter1>], [<filter2>], ... ) |
The function takes two types of arguments:
This is the calculation you want to perform. It works just like a regular DAX measure. You can use aggregation functions like SUM, AVERAGE, COUNT, MIN, MAX, and DISTINCTCOUNT inside this argument.
These are the conditions that modify the filter context for your expression. You can add one filter or many. A comma separates each filter. If you add multiple filters, they all apply together by default, which means all conditions must be true (AND logic).
A simple example looks like this:
North Sales = CALCULATE(SUM(Sales[Revenue]), Sales[Region] = "North") |
This measure returns the total revenue, but only where the Region is "North." It does not matter what other filters are active in the report. The CALCULATE function will always apply its own filter on top.
Also Read: Excel Formulas (Basic to Advanced)
Filter context is one of those concepts that sounds abstract at first, but it is absolutely essential for writing good DAX. If you skip this section, CALCULATE will always feel a little mysterious. If you read it carefully, everything about CALCULATE will start to make sense.
Every time a visual in Power BI renders, it creates a filter context. That context includes everything that is filtering the data at that moment: slicers the user has selected, filters on the visual, page-level filters, and row or column headers in a matrix or table.
For example, if you have a table that shows sales by month, each row creates its own filter context. January filters the data to January. February filters the data to February. A regular SUM measure will respect those filters automatically.
The CALCULATE function has the power to override or extend that filter context. This is called "context transition" and it is what separates beginner DAX writers from advanced ones.
When you use CALCULATE, it does two things:
Read Also: Pivot Table in Excel
Not every filtering situation is the same. Some require a simple condition. Others need row-by-row evaluation. And some require you to modify or remove filters entirely. CALCULATE supports all three scenarios through three distinct filter types, and knowing when to use each one will make your DAX much cleaner and faster.
The CALCULATE function supports three types of filters.
A Boolean filter is the simplest type. It returns either TRUE or FALSE for each row, and CALCULATE keeps only the rows where the result is TRUE.
Female Customers = CALCULATE(COUNTROWS(Customers), Customers[Gender] = "Female") |
Microsoft recommends using Boolean filters whenever possible because Power BI has specifically optimized them for performance. They work faster than other filter types.
A table filter uses the FILTER function to loop through each row of a table and return only the rows that match a condition. You use this type when you cannot express your filter as a simple TRUE/FALSE.
High Value Orders = CALCULATE(
    SUM(Orders[Amount]),
    FILTER(Orders, Orders[Amount] > 1000)
) |
Use table filters only when a Boolean filter cannot handle the logic. They are more flexible but slower because they evaluate row by row.
These are special DAX functions that change how filters work inside CALCULATE. The most common ones are:
Read Also: How to Calculate Age in Excel?
Knowing the syntax is one thing. Understanding the exact sequence of events that happens when CALCULATE runs is another. This step-by-step breakdown will help you predict how your measures will behave before you even test them in a report.
Here is exactly what happens when Power BI evaluates a CALCULATE formula:
This sequence is important to remember. The key rule is: CALCULATE replaces existing filters on the same column unless you explicitly tell it not to.
Theory only takes you so far. The best way to truly learn the CALCULATE function is to see it applied to real reporting scenarios. Each example below represents a situation you will actually encounter when building Power BI dashboards and reports.
Let us go through real use cases that you will encounter often when building Power BI reports.
Suppose you have a Sales table with a Category column. You want to show Electronics revenue regardless of what category is selected in a slicer.
Electronics Revenue = CALCULATE(
    SUM(Sales[Revenue]),
    Sales[Category] = "Electronics"
)
|
No matter what the user selects in a category slicer, this measure will always return the Electronics total. That is the power of CALCULATE overriding the existing filter context.
This is one of the most popular use cases for the CALCULATE function in Power BI reports.
You want each category to show its percentage share of total revenue. First, you create a total revenue measure that ignores the category filter:
Total Revenue = CALCULATE(
    SUM(Sales[Revenue]),
    ALL(Sales[Category])
)
|
Then you build the percentage measure:
Revenue % of Total = DIVIDE(SUM(Sales[Revenue]), [Total Revenue]) |
When you place both in a table with categories, each row will show its share of the total. The ALL function removes the category filter for the Total Revenue measure, so the denominator always reflects the full revenue.
Read Also: KPI in Power BI: Key Performance Indicators Dashboards
You want to display both Online and In-Store revenue in the same visual, regardless of a Channel slicer.
Online Revenue = CALCULATE(SUM(Sales[Revenue]), Sales[Channel] = "Online") |
InStore Revenue = CALCULATE(SUM(Sales[Revenue]), Sales[Channel] = "In-Store") |
Place both measures in a table or card visual, and you get a side-by-side comparison that does not change when the user interacts with other report filters (unless you design it to).
You want to see revenue from a specific region AND for a specific product category.
North Electronics Revenue = CALCULATE(
    SUM(Sales[Revenue]),
    Sales[Region] = "North",
    Sales[Category] = "Electronics"
)
|
When you separate multiple filters by commas inside CALCULATE, they combine with AND logic. Both conditions must be true for a row to be included.
Running totals are very common in financial and sales reporting. CALCULATE allows this with FILTER and ALLSELECTED functions.
Cumulative Revenue = CALCULATE(
    SUM(Sales[Revenue]),
    FILTER(
        ALLSELECTED(Sales[Date]),
        Sales[Date] <= MAX(Sales[Date])
    )
)
|
Here is what each part does:
Also Read: Excel Certifications
By default, multiple filters in CALCULATE use AND logic. If you want OR logic, you use the double pipe operator:
North or South Revenue = CALCULATE(
    SUM(Sales[Revenue]),
    Sales[Region] = "North" || Sales[Region] = "South"
)
|
This returns revenue from either North or South. You can also use the IN operator for cleaner syntax:
North or South Revenue = CALCULATE(
    SUM(Sales[Revenue]),
    Sales[Region] IN {"North", "South"}
)
|
Even experienced Power BI users make mistakes with CALCULATE. Most of the time, those mistakes come from misunderstanding how filter context works or from using a heavier approach when a simpler one would do the job. Knowing these pitfalls in advance will save you a lot of troubleshooting time.
Read Also: Excel ROUND(): A Quick Guide to Rounding in Excel
Both CALCULATE and slicers filter data in Power BI, but they serve very different purposes. Choosing the right tool for the right situation will make your reports more flexible and easier to maintain.
| Feature | CALCULATE (DAX Function) | Slicers (Report Filter UI) |
|---|---|---|
| What it is | A DAX function used in Power BI to modify filter context inside formulas | A visual filter users interact with on reports |
| Used by | Report developers / data analysts | End users / report viewers |
| Purpose | Perform custom calculations with specific filtering logic | Allow users to filter data interactively |
| Works in | Measures and calculated expressions | Report canvas |
| Control Type | Programmatic (written in code) | Visual and interactive |
| Main Advantage | Creates advanced business logic | Makes reports easy to explore |
| Example | Calculate sales only for 2025 | User selects 2025 from a dropdown slicer |
| Changes Filter Context? | Yes — internally in DAX | Yes — through user interaction |
| Dynamic? | Depends on formula logic | Fully dynamic based on user clicks |
| Complex Calculations | Excellent for YTD, ratios, conditional totals, comparisons | Cannot create calculations by itself |
| Best For | Business rules and advanced analytics | User-friendly report filtering |
| Requires DAX Knowledge? | Yes | No |
| Performance Impact | Can affect model performance if complex | Usually lightweight |
| Typical Example | CALCULATE(SUM(Sales[Amount]), Region="India") | Region slicer with options like India, USA, UK |
Related Article: Countif Function in Excel
| Situation | Use |
|---|---|
| Need custom logic in a measure | CALCULATE |
| Want users to filter reports themselves | Slicers |
| Need Year-to-Date or conditional totals | CALCULATE |
| Want interactive dashboards | Slicers |
| Need both business logic + user filtering | Use BOTH together |
Related Article: Excel Multiply Formulas
Time-based analysis is one of the most common requirements in business reporting. Sales teams want to see month-over-month trends. Finance teams need year-to-date totals. Executives want year-over-year comparisons. The CALCULATE function is the backbone of all these calculations when you pair it with DAX time intelligence functions.
CALCULATE pairs naturally with DAX time intelligence functions. These functions let you shift the filter context to a different time period.
Year-to-Date Revenue:
YTD Revenue = CALCULATE(SUM(Sales[Revenue]), DATESYTD(Dates[Date])) |
Previous Year Revenue:
PY Revenue = CALCULATE(SUM(Sales[Revenue]), SAMEPERIODLASTYEAR(Dates[Date])) |
Year-over-Year Growth:
YoY Growth = DIVIDE([Total Revenue] - [PY Revenue], [PY Revenue]) |
For time intelligence functions to work correctly, you need a proper Date table in your model marked as a date table. This is a best practice that applies across all DAX time intelligence calculations.
Also Read: What is XLOOKUP and How to Use It?
Writing a CALCULATE measure that returns the right answer is only half the job. Writing one that runs efficiently is the other half. As your data model grows and your reports become more complex, performance starts to matter more. These tips will help you keep your reports fast and responsive.
Read Also: How to Use HLOOKUP Function?
When you are in the middle of creating a report, you do not always want to search through documentation to remember which filter type to use. This cheat sheet gives you a fast reference for every major filter option available inside the Power BI CALCULATE function.
| Filter Type | Syntax | When to Use? |
|---|---|---|
| Boolean filter | Sales[Region] = "North" | Simple equality or comparison |
| Multiple AND filters | Filter1, Filter2 | All conditions must be true |
| OR filter | Condition1 || Condition2 | At least one condition must be true |
| Table filter | FILTER(Table, condition) | Complex row-by-row filtering |
| Remove all filters | ALL(Table[Column]) | Grand total calculations |
| Keep external filters | ALLSELECTED(Table[Column]) | Percentage of visible total |
| Preserve existing filter | KEEPFILTERS(condition) | Add without overriding |
Related Articles: How to Use the VLOOKUP Function?
CALCULATE evaluates an expression inside a modified filter context. You can pass Boolean filters, table filters, or filter modification functions as arguments. Multiple filters combine with AND logic by default. Functions like ALL, ALLSELECTED, and KEEPFILTERS give you granular control over how existing filters interact with your new ones. CALCULATE powers everything from simple segment comparisons to running totals, percentage-of-total calculations, and time intelligence.
Start simple. Write a CALCULATE measure with one Boolean filter and see how it behaves in a table or card visual. From there, layer in ALL for percentage calculations and FILTER for more complex logic. The more you use it, the more natural it will feel.
Yes. CALCULATE(SUM(Sales[Revenue])) with no filters is valid. It evaluates the expression inside the current filter context, which can still be useful when you want to trigger a context transition in an iterator.
No. CALCULATE is a function you use inside a DAX measure or calculated column formula. A calculated column is a column you add to a table in Power BI using any DAX formula, which may or may not include CALCULATE.
Yes. You can use CALCULATE inside DAX expressions that return tables, including calculated tables.
Both remove filters, but REMOVEFILTERS is more explicit and easier to read. Microsoft introduced REMOVEFILTERS as a clearer alternative to ALL when used in a CALCULATE filter argument. They behave the same way for most practical purposes.