Decisiveness and diligence play a crucial role in helping businesses enhance their data analysis and utilization. That's exactly why choosing the right business intelligence (BI) tool often becomes confusing for many of us. With so many dashboards, charts, and features available, one common question keeps popping up: Power BI or Tableau - which one actually makes sense for your needs?
Power BI and Tableau are currently the two most dominant BI tools in the market that are widely used across industries for reporting, data visualization, and decision-making. Power BI has experienced massive adoption due to its deep integration with Microsoft tools and cost-effective pricing, while Tableau remains a favorite for advanced visual analytics and handling complex datasets. Both tools are heavily used in real-world scenarios such as sales analysis, financial reporting, operational dashboards, and executive decision support.
I actively use both Power BI and Tableau in different scenarios, and each tool shines in its own way. Over time, I've noticed that the "best" tool often depends less on features and more on how and where you plan to use it. In this guide, I'll share my genuine, hands-on experience with both Power BI and Tableau, explaining where each tool performs better, where it struggles, and what kind of users benefit most from them.
If you are learning Power BI or Tableau, planning a career in data analytics, or deciding which BI tool to adopt for your organization, this guide will help you make a clear, practical, and confident choice - without the usual marketing noise.
Power BI is a business intelligence platform developed by Microsoft that focuses on turning raw data into meaningful and actionable insights. It offers a clean, user-friendly interface with rich and interactive visualizations that make it easier for users to understand complex data. Power BI can connect to multiple data sources and supports data transformation, cleansing, analysis, and custom calculations within a single environment. It is accessible across devices, including desktop applications, web browsers, and mobile devices, allowing users to monitor and analyze data anytime, anywhere.
This section highlights the strengths and limitations of Power BI to help you understand when it is the right choice.
| Pros of Power BI | Cons of Power BI |
| Very easy to learn for beginners and non-technical users | Can struggle with extremely large or complex datasets |
| Deep integration with Microsoft tools like Excel, Azure, Teams, and SharePoint | Advanced visual customization is limited compared to Tableau |
| Affordable pricing, especially for small teams and startups | Requires strong DAX knowledge for complex calculations |
| Powerful data modeling and relationship handling | Desktop version mainly supports Windows OS |
| Real-time dashboards and streaming data support | Performance tuning options are limited |
| Strong security features with role-based access control | Collaboration features depend heavily on Power BI Service |
| Regular updates and new features from Microsoft | Custom visuals sometimes impact report performance |
| Ideal for self-service BI and quick reporting | Less flexible for non-Microsoft data ecosystems |
Tableau is a data visualization and business intelligence tool that helps people understand data by turning it into clear and interactive visuals. It allows users to connect to different data sources and explore information using simple drag-and-drop actions, without needing strong technical skills. Tableau is mainly used to create charts, dashboards, and reports that make trends and patterns easy to spot. Because of its simplicity and strong visual capabilities, it is widely used by analysts and businesses to make data-driven decisions faster.
This section explains the advantages and drawbacks of Tableau.
| Pros of Tableau | Cons of Tableau |
| Best-in-class data visualization and storytelling | Expensive licensing compared to Power BI |
| Handles very large and complex datasets efficiently | Steeper learning curve for beginners |
| Platform-independent and works across multiple ecosystems | Advanced features can feel overwhelming at first |
| Highly interactive dashboards with deep customization | Less seamless integration with Microsoft products |
| Strong performance due to in-memory and query optimization | Requires careful dashboard optimization |
| Excellent for exploratory data analysis | Collaboration features vary by license type |
| Widely adopted by enterprises and large organizations | Cost increases quickly as users grow |
| Strong community support and learning resources | Not ideal for teams with tight budgets |
Here is the quick comparison to help you understand the core differences between Power BI and Tableau instantly.
| Feature | Power BI | Tableau |
| Developed By | Microsoft | Salesforce |
| Primary Focus | Business intelligence and reporting | Advanced data visualization and analytics |
| Ease of Use | Very beginner-friendly | Easy to use, but slightly steeper learning curve |
| Data Visualization | Good, interactive visuals | Industry-leading, highly customizable visuals |
| Data Source Connectivity | Strong, especially with Microsoft tools | Very strong, supports many cloud and database sources |
| Performance with Large Data | Slows with very large datasets | Handles large and complex datasets better |
| Integration | Best with Microsoft ecosystem (Excel, Azure, Teams) | Platform-independent, works across ecosystems |
| Pricing | More cost-effective | Generally more expensive |
| Ideal For | Beginners, small to mid-sized businesses | Enterprises, experienced analysts |
| Learning Curve | Short | Moderate |
Let's look at some points to understand the similarities between Power BI vs Tableau -
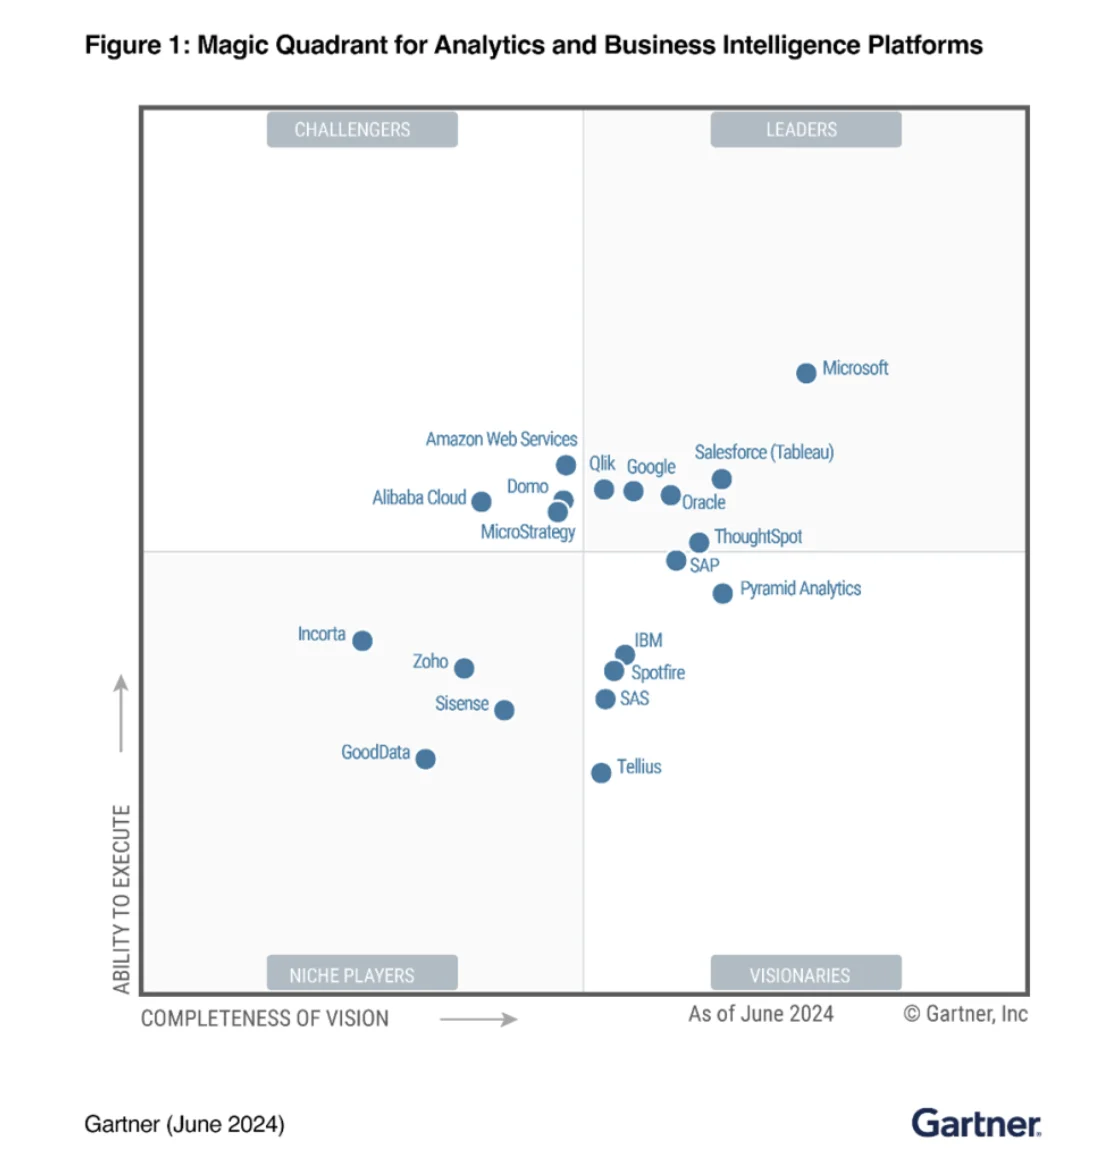 A Gartner report proves that Microsoft Power BI and Tableau are the two most popular business intelligence platforms of 2025. The average rating of these tools is 4.4 from 3000 reviews. Both of these are popular among different individuals. Power BI is mostly used by beginners, while Tableau is used by experienced data analysts. Market share of Tableau and Power BI is 15.08% and 13.68% respectively.
Connectivity to different data sources is very important for business intelligence. Gathering information from multiple sources is a must for efficient decision-making. When we compare Tableau and Power BI can see that both of them have the capability to connect with different datasets. These include MS Excel, JSON, CSS, and 50+ additional data connectors.
Both of these tools can showcase information in different ways. Here, users get different visualization options like treemaps, geographical maps, reports, bars, and charts. These business intelligence tools have intrusive dashboards where users can perform different operations on information. It gives a better view of information for decision-making.
There is no requirement of programming languages to work on these tools. Both of these have easy to learn interfaces. This means any analysts with and without a coding background can work on this platform.
There are very few differences when we compare Power BI and Tableau. These differentiate in integrations, performance, ease of use, and features. These differences have to be considered while choosing which one is best for your business.
Power BI is integrated with Microsoft products only. It can only be used for particular instances. There is no use of this tool apart from this integration. Tableau is a versatile tool that is not limited to any platform. It gives a wide range of scalability by connecting different types of cloud services.
Both of these tools are robust in terms of performance, but in their own way. Tableau was particularly designed to manage business-sized data sets. They further added some additional capabilities, like in-memory caching, with hyper speed up queries. Now it is compatible with multi-core processors, which speeds up its performance.
Power BI also has in-memory capabilities. It usually slows down when handling humongous data sets. This means it is only capable of managing particular data types and sizes effectively. Tableau is a slightly better tool when it comes to performance factors.
Power BI is widely considered easier to learn, particularly for beginners and professionals already familiar with Microsoft tools. Its interface is intuitive, and basic reports can be built quickly with minimal technical knowledge.
Tableau also offers a drag-and-drop interface, but mastering its advanced visualization and analytical features takes more time. As a result, Tableau is often preferred by experienced analysts who need deeper control over data exploration and storytelling.
Power BI offers very strong data modeling capabilities, especially through DAX (Data Analysis Expressions). Users can create complex calculations, measures, and relationships between tables, which makes Power BI highly effective for financial reporting and structured business models. However, DAX has a learning curve, and beginners may find advanced formulas challenging at first.
Tableau handles calculations differently by focusing more on visual and exploratory analysis. It uses calculated fields that are easier to understand for basic logic, but can become complex when advanced calculations are required. Tableau is excellent for quick insights and visual analysis, but it is generally less powerful than Power BI when it comes to deep data modeling and reusable calculation logic.
Read Also- How To Become A Power BI Developer- A Comprehensive Guide
Pricing is also an important factor when choosing a better business intelligence tool between Tableau and Power BI. Both of these tools have different types of pricing models. The table given below is a detailed overview of these models -
| Plan / License | Power BI (Microsoft Official) | Tableau (Tableau Official) |
| Free Version | Power BI Desktop is available for free for individual use (no sharing). (Microsoft) | Tableau offers a 14-day free trial, but no permanent free license. (Tableau) |
| Entry-Level Paid | Power BI Pro: $14/user/month (paid yearly). (Microsoft) | Tableau Viewer: $15/user/month (billed annually). (Tableau) |
| Mid-Tier | Power BI Premium Per User: $24/user/month (paid yearly). (Microsoft) | Tableau Explorer: $42/user/month (billed annually). (Tableau) |
| Full Creator / Advanced | Power BI no separate creator role - advanced features are included in Premium tiers. (Microsoft) | Tableau Creator: $75/user/month (billed annually). (Tableau) |
| Enterprise / Dedicated | Power BI Premium Capacity: starts from a capacity price (enterprise scale). (Microsoft) | Tableau has Enterprise plans with additional bundles and add-ons (contact sales). (Tableau) |
As I have already discussed all the differences between Power BI and Tableau, let's discuss how Gartner has rated their experience.
| Features | Power BI | Tableau |
| Ease of development | 4.4 | 4.4 |
| Data preparation | 4.4 | 4.3 |
| Data source connectivity | 4.2 | 4.3 |
| Ease of use | 4.3 | 4.4 |
| Self-contained ETL and data storage | 4.0 | 3.6 |
| Analytics dashboards | 4.5 | 4.6 |
| Advanced analytics | 4.3 | 4.3 |
| Interactive visual exploration | 4.5 | 4.6 |
| Collaboration and sharing | 4.1 | 4.0 |
| Price flexibility | 4.2 | 3.7 |
You can also read- Power BI Career Opportunities and Job Roles
Choosing between Power BI and Tableau is not just about features or pricing; it largely depends on your role, daily responsibilities, and the type of data you work with. Different professionals use business intelligence tools in different ways, and understanding this context makes the decision much easier.
If you work as a business analyst and spend a lot of time with Excel, PowerPoint, Microsoft Teams, or SharePoint, Power BI is often the more practical choice. It allows quick report creation, strong data modeling with DAX, and easy sharing within the Microsoft ecosystem. Power BI works well for routine reporting, KPI tracking, and management dashboards that need frequent updates.
For data analysts who focus on exploratory analysis, complex visual storytelling, and pattern discovery, Tableau often feels more flexible. Its drag-and-drop interface makes it easier to explore data visually without predefined models. If your role involves frequent ad-hoc analysis or presenting insights to stakeholders in a highly visual way, Tableau can offer more creative freedom.
Data engineers usually care less about visuals and more about data pipelines, scalability, and performance. In Microsoft-centric environments, Power BI integrates well with Azure Synapse, Azure Data Factory, and Microsoft Fabric. However, if your data pipelines span multiple cloud platforms or heterogeneous systems, Tableau’s platform-independent connectivity can be more suitable for downstream analytics.
For startup founders, cost, speed, and simplicity matter the most. Power BI is generally a better starting point because of its lower pricing and faster onboarding, especially if the startup already uses Microsoft tools. Tableau may be more powerful, but its higher licensing cost can be difficult to justify in early-stage businesses unless advanced analytics are a strict requirement.
Large enterprise BI teams often work with massive datasets, multiple data sources, and strict governance requirements. Tableau is commonly preferred in such environments due to its strong performance with large-scale data and advanced visualization capabilities. That said, enterprises heavily invested in Microsoft Azure increasingly lean toward Power BI because of its deep integration and centralized governance through Microsoft Fabric.
For freelancers and BI consultants, the choice depends on client requirements. Power BI is in high demand for projects involving Microsoft-based organizations, while Tableau is often requested by clients who prioritize advanced dashboards and cross-platform analytics. Professionals who work with diverse clients often benefit from learning both tools to stay flexible and competitive.
Read Also- Microsoft Fabric vs Power BI: Which One Should You Choose?
Understanding features is important, but tools are best judged by how they perform in real business situations. Power BI and Tableau behave differently depending on the use case, data size, and audience. Below are some common real-world scenarios to help you clearly see which tool fits better and why.
In a typical mid-sized organization, sales data usually comes from CRM tools, Excel sheets, and internal databases. Power BI performs very well in this scenario because of its strong integration with Excel and Microsoft ecosystems. Building sales dashboards, tracking KPIs, and sharing reports with managers becomes quick and cost-effective.
Tableau can also handle sales dashboards smoothly, especially when visuals need to be more interactive or presentation-focused. However, for most mid-sized companies, Power BI offers a faster setup and lower cost, making it the more practical choice.
Better Choice: Power BI
Trade-off: Tableau offers richer visuals, but Power BI wins on simplicity and cost.
When dealing with enterprise-level reporting and extremely large datasets, performance becomes a critical factor. Tableau is designed to handle massive datasets efficiently using advanced query optimization and in-memory processing. It performs well even when users interact with complex dashboards built on hundreds of millions of rows.
Power BI can manage large datasets, but performance tuning becomes necessary as data volume grows. Without careful model optimization, reports may feel slower in such scenarios.
Better Choice: Tableau
Trade-off: Higher cost, but better performance and scalability for large data volumes.
Leadership teams often need quick insights rather than deeply modeled reports. Tableau excels here because it allows fast, visual exploration of data without heavy upfront modeling. Analysts can answer “what-if” questions quickly and adjust views during discussions.
Power BI is more structured and works best when data models are already defined. While it can support ad-hoc analysis, Tableau feels more flexible for spontaneous exploration.
Better choice: Tableau
Trade-off: Power BI provides stronger governance, but Tableau offers faster exploration.
For dashboards that are shared directly with clients, visual appeal and interactivity matter a lot. Tableau is widely preferred for client-facing dashboards due to its polished visuals and storytelling capabilities. It allows users to interact deeply with data, which improves client engagement.
Power BI can also be used for external dashboards, especially when clients are already part of the Microsoft ecosystem. However, Tableau generally delivers a more refined visual experience for external stakeholders.
Better Choice: Tableau
Trade-off: Power BI is easier to manage internally, but Tableau shines in presentation quality.
For internal reporting, operational dashboards, and routine monitoring, Power BI is often the better option. It integrates smoothly with internal systems, supports automated refreshes, and works well for daily business tracking. Teams can collaborate easily using Microsoft Teams and SharePoint.
Tableau is powerful here as well, but it may feel like overkill for simple operational reporting.
Better Choice: Power BI
Trade-off: Tableau offers deeper visuals, but Power BI is more efficient for everyday reporting.
Read Also- Tableau Certifications Guide - Certification Levels and How to Pass
The demand for Power BI and Tableau professionals is expected to grow steadily as organizations continue to rely on data-driven decision-making. This table explains the future scope and career demand of both tools beyond 2026.
| Aspect | Power BI | Tableau |
| Job Demand | Very high demand across industries | Strong demand, mainly in enterprises |
| Common Roles | Business Analyst, Power BI Developer, Data Analyst | Data Analyst, BI Consultant, Analytics Lead |
| Industry Adoption | Widely used in Microsoft-centric organizations | Preferred in analytics-driven and large enterprises |
| Ecosystem Growth | Growing rapidly with Microsoft Fabric and Azure | Growing within the Salesforce ecosystem |
| Entry-Level Opportunities | More beginner-friendly and accessible | Fewer entry-level roles, higher skill expectations |
| Enterprise Usage | Increasing adoption as a standard BI tool | Well-established in large organizations |
| Salary Trend | Competitive and stable | Generally higher for experienced roles |
| Long-Term Relevance | Strong due to end-to-end analytics integration | Strong for advanced analytics and visualization |
Power BI and Tableau are both powerful business intelligence tools, but they serve different purposes depending on business needs. Power BI is ideal for organizations that rely on the Microsoft ecosystem and want a cost-effective, easy-to-learn solution for reporting and analytics. Tableau, on the other hand, stands out for advanced data visualization, strong performance with large datasets, and enterprise-level analytics requirements.
Related Articles
Q1. Is Power BI better than Tableau for beginners?
Yes. Power BI is more beginner-friendly due to its simple interface, lower cost, and strong integration with familiar Microsoft tools like Excel, making it easier to learn and use initially.
Q2. Which Tool Is Better for Enterprise BI?
Tableau is generally better for enterprise BI because it handles large, complex datasets efficiently and offers advanced visualization and scalability suited for enterprise-level analytics.
Course Schedule
| Course Name | Batch Type | Details |
| Data Science and BI Certification Courses | Every Weekday | View Details |
| Data Science and BI Certification Courses | Every Weekend | View Details |