Power BI is a widely used business intelligence tool for data analysis and visualization. As a data analyst, I regularly use Power BI to build interactive reports, and one of its most powerful features is DAX (Data Analysis Expressions), which plays a key role in my day-to-day analysis work. DAX in Power BI is a formula language used to create custom calculations such as totals, percentages, time-based values, and business metrics that automatically update when users apply filters or slicers.
In this article, I will explain what DAX Power BI is, the types of functions, how to write DAX formulas, and share practical examples to help you understand it better.
Let's get started.
DAX (Data Analysis Expressions) is a formula language used in Power BI to create custom calculations on data. It helps you calculate totals, percentages, time-based values, and business metrics that are not possible with visuals alone.
Simply put, DAX adds logic and intelligence to your reports. When users apply filters or slicers, DAX formulas automatically recalculate results, making reports dynamic and interactive. As you grow in Power BI, DAX becomes essential for building meaningful insights and real-world business analysis.
For example, a basic DAX formula like the one below calculates total sales:
| Total Sales = SUM(Sales[SalesAmount]) |
Before writing a single function, you must understand the Evaluation Context. This is the single most important concept in DAX and is the environment in which your formulas are calculated. It has two primary components: Filter Context and Row Context.
The Filter Context is the set of active filters applied to the data model at any given time. Think of it as all the filters coming from your report visuals, slicers, and even other DAX formulas. For example, if a user selects "2025" from a year slicer and "USA" from a country slicer, the filter context ensures that any DAX measure will only calculate on the data for "2025" and "USA". The most powerful function in DAX, CALCULATE, is designed specifically to manipulate this filter context.
The Row Context means "the current row." It exists when you are iterating through a table, one row at a time. This happens automatically in a Calculated Column, where the formula is evaluated for each row of the table. It can also be created manually inside a measure using iterator functions (like SUMX or FILTER). Understanding when you are in a row context versus a filter context is crucial for writing correct and efficient DAX.
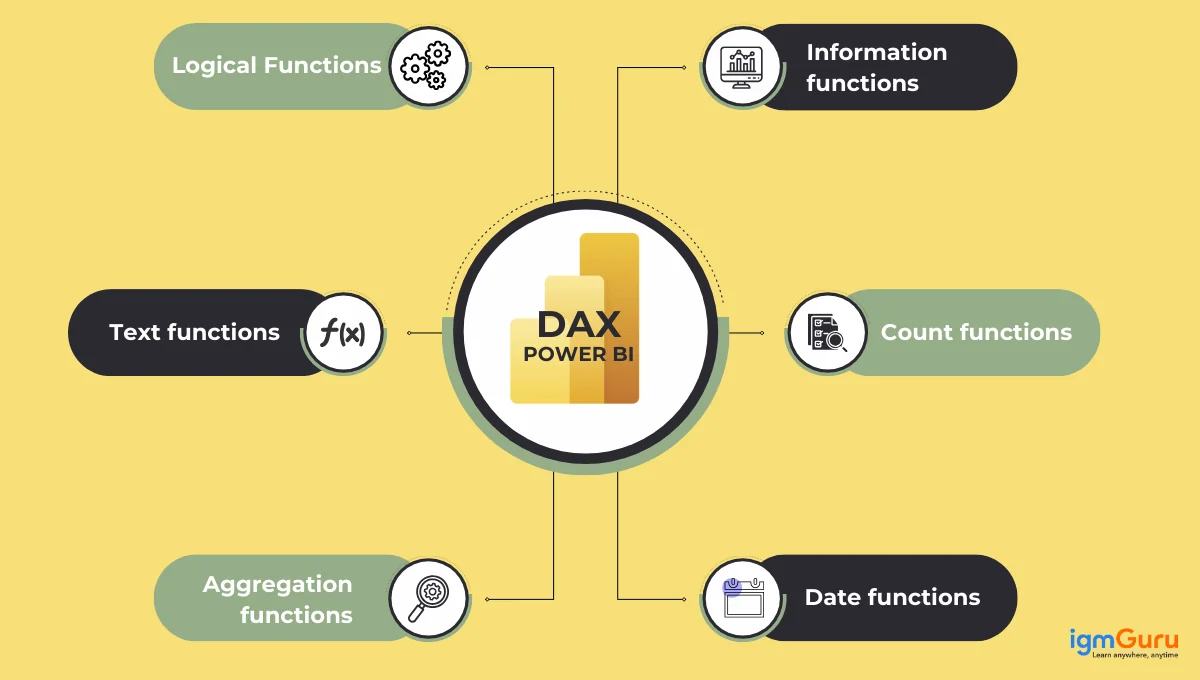
The following are the types of DAX functions:
| Category | Common DAX Functions | Syntax Example | Purpose |
| Date & Time | DATE, CALENDARAUTO, YEAR, MONTH, TODAY |
YEAR(Date[OrderDate]) |
Create and extract date-related values |
| Time Intelligence | TOTALYTD, TOTALMTD, TOTALQTD, SAMEPERIODLASTYEAR, DATEADD |
TOTALYTD([Sales], Date[Date]) |
Perform year-over-year, month-to-date, and trend analysis |
| Logical | IF, SWITCH, AND, OR, COALESCE |
IF([Sales]>1000,"High","Low") |
Apply conditional logic to calculations |
| Math & Trigonometry | SUM, DIVIDE, ROUND, ABS, INT |
DIVIDE([TotalSales],[TotalOrders]) |
Perform arithmetic and safe mathematical operations |
| Aggregation | AVERAGE, MIN, MAX, COUNT, COUNTROWS |
AVERAGE(Sales[Amount]) |
Summarize and aggregate data |
| Filter & Context | CALCULATE, FILTER, ALL, ALLEXCEPT, VALUES
| CALCULATE([Sales], ALL(Date)) |
Modify filter context and control calculations |
| Iterator | SUMX, AVERAGEX, MINX, MAXX |
SUMX(Sales, Sales[Qty]*Sales[Price]) |
Perform row-by-row calculations before aggregation |
| Text | CONCATENATE, LEFT, RIGHT, MID, FORMAT |
FORMAT([Sales],"#,##0") |
Manipulate and format text values |
| Table | ADDCOLUMNS, SUMMARIZE, SELECTCOLUMNS |
SUMMARIZE(Sales, Sales[Year]) |
Create and shape tables within the data model |
| Relationship | RELATED, USERELATIONSHIP, CROSSFILTER |
RELATED(Product[Category]) |
Work with table relationships and model behavior |
| Information | ISBLANK, HASONEVALUE, ISFILTERED |
ISFILTERED(Date[Year]) |
Check data state and filter conditions |
| Statistical | MEDIAN, STDEV.P, STDEV.S, VAR.P, RANKX |
RANKX(ALL(Products), [Sales]) |
Perform statistical analysis and ranking on data |
Many beginners do not understand statistical functions, but they play an important role in the work of data analysts who are analyzing distributions, determining rank, or predicting future trends. For example:
Although DAX includes hundreds of functions, most Power BI reports are built using a relatively small set of functions. Learning these commonly used DAX functions first will help you write calculations faster and solve most real-world business reporting requirements.
| DAX Function | Purpose | Example |
SUM() |
Adds all values in a numeric column. | SUM(Sales[SalesAmount]) |
SUMX() |
Performs row-by-row calculations before summing the results. | SUMX(Sales, Sales[Quantity] * Sales[UnitPrice]) |
CALCULATE() |
Change the filter context before evaluating an expression. | CALCULATE([Total Sales], Geography[Country]="USA") |
FILTER() |
Returns a filtered table based on a condition. | FILTER(Sales, Sales[Amount] > 1000) |
ALL() |
Removes filters from one or more columns or tables. | CALCULATE([Sales], ALL(Product)) |
REMOVEFILTERS() |
Clears filters while preserving the calculation logic. | REMOVEFILTERS(Product) |
VALUES() |
Returns distinct values from a column. | VALUES(Product[Category]) |
RELATED() |
Retrieves values from a related table. | RELATED(Product[Category]) |
DIVIDE() |
Performs safe division and avoids divide-by-zero errors. | DIVIDE([Profit],[Sales]) |
IF() |
Returns different values based on a condition. | IF([Sales]>1000,"High","Low") |
SWITCH() |
Evaluates multiple conditions more efficiently than nested IF statements. | SWITCH(TRUE(), [Sales]>5000,"Excellent",[Sales]>1000,"Good","Low") |
RANKX() |
Ranks values within a table. | RANKX(ALL(Product),[Total Sales]) |
COUNTROWS() |
Counts the number of rows in a table. | COUNTROWS(Sales) |
AVERAGE() |
Calculates the average of a numeric column. | AVERAGE(Sales[SalesAmount]) |
TOTALYTD() |
Calculates Year-to-Date totals. | TOTALYTD([Sales], Date[Date]) |
SAMEPERIODLASTYEAR() |
Returns values from the same period in the previous year. | SAMEPERIODLASTYEAR(Date[Date]) |
DATEADD() |
Shifts dates forward or backward by a specified interval. | DATEADD(Date[Date],-1,YEAR) |
SELECTEDVALUE() |
Returns the selected value when only one value exists. | SELECTEDVALUE(Product[Category]) |
HASONEVALUE() |
Checks whether only one value is selected. | HASONEVALUE(Product[Category]) |
COALESCE() |
Returns the first non-blank value. | COALESCE([Profit],0) |
These functions form the foundation of most Power BI reports. Once you understand how they interact with filter context and row context, you will be able to build dashboards that include KPIs, year-over-year comparisons, rankings, running totals, profitability analysis, and many other business metrics.
In DAX, you can create calculations as either a calculated column or a measure. Choosing the right one is essential for performance and model size.
A calculated column physically adds a new column to a table. The calculation is performed once for each row during data refresh and the results are stored in your model. This consumes RAM and increases file size.
Best for static, row-level attributes that you want to use in slicers, filters, or as an axis in a chart (e.g., creating a "Price Tier" column like 'High', 'Medium', 'Low' based on product price).
A measure is a dynamic calculation that is evaluated at query time, based on the current filter context. The result is not stored in your model.
Best for aggregations shown in visuals, like total sales, profit margin, or year-over-year growth. This is where most of your DAX logic should live.
Related Article- How to Create a Dashboard in Power BI: A Step-By-Step Guide
Forget memorizing hundreds of functions. Instead, master these core patterns that form the backbone of nearly all enterprise-level reports.
CALCULATE is the most important function in DAX. It modifies the filter context before performing a calculation. It allows you to override, add, or remove filters to answer complex business questions.
| CALCULATE(<expression>[, <filter1>[, <filter2>…]]) |
Example: Calculate the total sales just for the "USA" region, regardless of what the user has selected in a slicer.
| Sales USA = CALCULATE( SUM('Sales'[SalesAmount]), 'Geography'[Country] = "USA" ) |
Iterator functions perform a calculation for each row of a table (creating a row context) and then aggregate the results. This is essential when you need to work with multiple columns at the row level.
| SUMX(<table>, <expression>) |
Example: Calculate total revenue by multiplying quantity and price for each row in the Sales table before summing the total. A simple SUM function could not do this.
| Total Revenue = SUMX('Sales', 'Sales'[Quantity] 'Sales'[UnitPrice]) |
DAX includes a powerful set of functions for analyzing data over time. A proper date table is a prerequisite for using these functions effectively.
Example: A common and high-value KPI is Year-over-Year (YoY) Sales Growth. This requires comparing sales from the current period to the same period in the previous year.
|
Sales YoY % = VAR CurrentYearSales = SUM('Sales'[SalesAmount]) VAR PriorYearSales = CALCULATE(SUM('Sales'[SalesAmount]), SAMEPERIODLASTYEAR('Date'[Date])) RETURN DIVIDE(CurrentYearSales - PriorYearSales, PriorYearSales) |
Notice the use of VAR. Variables are crucial for writing clean, readable, and highly performant DAX. They allow you to store the result of an expression and reuse it, preventing Power BI from having to perform the same calculation multiple times within one formula.
Related Article: Power BI Dashboard Examples
To move from an intermediate to an expert DAX user, you must leverage external tools. The community has built incredible free and open-source applications that integrate with Power BI Desktop to supercharge your development workflow.
While the syntax appears simple, writing effective DAX is about mastering the context in which it operates. The formula structure remains consistent:
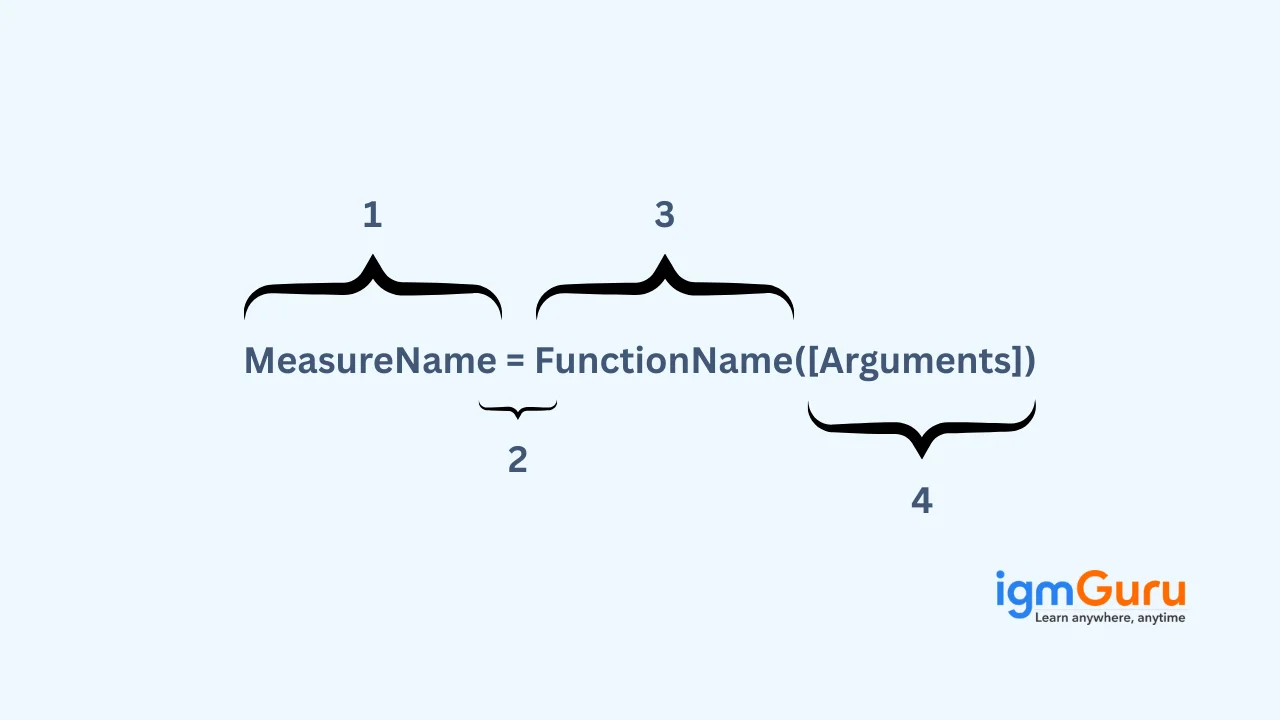
1. Measure Name: This is the name of your calculation (e.g., `[Total Revenue]`). It should be descriptive and enclosed in square brackets when referenced in other measures.
2. Assignment Operator (:= or =): The `:=` operator is the standard in DAX Studio and Tabular Editor, while `=` is used in the Power BI formula bar. They assign the expression to the measure name.
3. DAX Function: A function like `SUMX`, `CALCULATE`, or `DIVIDE` that operates.
4. Arguments: The inputs for the function, which can be table names, column references (e.g., `'Sales'[Quantity]`), or other expressions.
Developing your skill in using Data Analysis Expressions in Power BI involves more than simply becoming familiar with syntax; it also involves learning how DAX formulas are affected by their context. Before we cover the syntax rules, let me show you where you will want to create DAX formulas in Power BI Desktop, as many novices understand the formula itself, but do not understand where they will enter it.
Once you are operating within Power BI Desktop, start by opening it and connecting to your data. To illustrate this point, let's suppose you are working with a Sales table that has columns for SalesAmount, Quantity, UnitPrice, and Country. Creating a recipe requires knowing what is in your pantry, and writing DAX formulas is similar; therefore, having access to relevant datasets is very helpful when working with DAX.
Next, select the Modeling tab at the top of the Power BI Desktop window. This is where you will find anything DAX-related. There are three types of buttons you will find. The three buttons that matter most to DAX users are:
Alternatively, you may right-click on any Table Name in the "Fields" pane on the right side of the screen and select "New Measure" in the dropdown to open the New Measure Formatting window. Most experienced analysts use this as the most efficient way to create DAX Measures.
Once you click New Measure, a Formula Bar opens just below the ribbon at the top of your Report canvas. There is a placeholder in the measure you are creating which looks like this:
Measure = |
This is where you type your DAX formula. The Formula Bar was designed to operate exactly as an Excel formula bar does; however, you need to remember that DAX is not Excel!! You do not refer to individual cells such as A1 or B2. You will be referencing entire columns or entire Tables.
Erase the default placeholder and type your formula. The first Measure you will create is the most elementary DAX Measure: Total Sales.
Total Sales = SUM(Sales[SalesAmount])
Notice the structure of the formula above:
Total Sales — The name of the measure; should be descriptive enough so that when your audience sees it in your report they know exactly what it calculates.
= — The formula begins with an assignment operator.
SUM — The name of a DAX function is being used to calculate the measure.
Sales[SalesAmount] — This is the name of the table, “Sales,” and the column name, “SalesAmount,” enclosed in square brackets.
As you type, Power BI's IntelliSense will suggest function names and column references automatically. Use the arrow keys to navigate suggestions and press Tab to accept one.
Press the Enter key or click on the checkmark icon located to the left of the formula bar after creating a formula.
Below the Formula Bar, if there is a complete error(s) within the formula created, a red error message will be printed below the Formula Bar for that formula. Common errors that may occur are:
Misspelled Column/Table Name(s)
No closing Parentheses
Data Type Passed To Function Is Wrong
Once you have corrected the error(s), reconfirm the formula you just entered.
You should see your new measure listed in the Fields pane on the right, under the table to which it was created. Measures are identified with a calculator icon (Σ), differentiating them from standard columns.
Now you can take your Total Sales measure and add it to any of the visuals within Power BI. For example:
Add it into a Card visual, which will display one total value.
Add it into the Values axis of a Bar Chart, which will show how the Total Sales break down by Category or Region.
Add it to a Slicer (for example, a Year Slicer), and the Total Sales measure will dynamically update as the user interacts with filters.
The ability to dynamically update measures based on the selection of filters/slicers is a key advantage of using DAX Measures when compared to Calculated Columns that only evaluate when the data is refreshed.
The process for creating a Calculated Column is exactly the same as that of using a Measure, but in Step 3, you click on “New Column” rather than “New Measure.” For instance, you could create price categories based on the price of each product.
Price Category = IF(Product[Price] > 1000, "High", "Low" |
This formula will calculate the price category for every row in the Product table during data refresh and save it as a new column. You can then use this column in slicers and as chart axes or in filters — just as you would for other columns in your dataset.
Reminder: Calculated Columns should be used for static, row-level labels and categories; Measures should only be used for any aggregation or KPI shown inside a visual. Getting this right will help keep your model lean and your reports fast.
Creating a Calculated Table
You can create your own table in Power BI using DAX. If you want to create a table from scratch, click "New Table" from the "Model" menu. Here is an example formula for summing total sales by country in Power BI:
Sales by Country = SUMMARIZE(Sales, Sales[Country], "Total Sales", SUM(Sales[Sales"])) |
This will create a new calculated table in your model with total sales summed by country, all created using DAX, and you do not have to return to your original data source.
| Component | What It Is | Example |
| Measure Name | The name of your calculation | Total Sales |
| Assignment Operator | Starts the formula | = |
| DAX Function | The operation being performed | SUM, CALCULATE, SUMX |
| Table Reference | The table your data lives in | Sales |
| Column Reference | The specific column inside the table | [SalesAmount] |
| Arguments | Additional inputs the function needs | Filters, expressions, conditions |
DAX formulas are primarily used in three ways within a Power BI model:
Also Explore: Excel Formulas
Many beginners struggle to use DAX at the beginning. It is not because the functions are complicated, but they misunderstand how it works behind the scenes. Let’s go through the common DAX mistakes to know what to avoid:
DAX and Excel share a similar syntax and many function names, but work on completely different logics and data structures. Excel is usually used for spreadsheet calculations. DAX is used for data analysis and business reporting in Power BI.
Example:
A common mistake in DAX is writing a very long formula in a single line without using variables. The formula may work, but it becomes difficult to read and fix it later. When you use variables, your calculation becomes easier and clearer to understand.
Profit % = DIVIDE(SUM(Sales[Revenue]) - SUM(Sales[Cost]), SUM(Sales[Revenue])) |
Profit % = VAR Revenue = SUM(Sales[Revenue]) VAR Cost = SUM(Sales[Cost]) RETURN DIVIDE(Revenue - Cost, Revenue) |
The calculate function is one of the most powerful and frequently used functions in DAX and complicated at the same time. You need to understand what it can do before actually using it in your real-world application.
Sales USA = CALCULATE(SUM(Sales[SalesAmount]), Geography[Country] = "USA") |
This formula calculates sales only for the USA, even if other countries are selected in the slicer.
Measures and calculated columns may look similar but serve different purposes. Measures are dynamic DAX-based calculations computed at query time. Calculated columns add raw-level data calculated during refresh, stored in model and best for slicers. Let’s understand their proper use:
Price Category = IF(Product[Price] > 1000, "High", "Low") |
Total Sales = SUM(Sales[SalesAmount]) |
Understanding DAX error messages can be confusing, particularly when something goes wrong. Here are five common errors in DAX:
The message "A circular dependency has been detected" means that a calculated column or measure references itself directly or indirectly through a chain of calculations. You may have circular dependencies in your formula; if so, you must identify the dependent columns and break that chain.
The message "The value for column X in table Y cannot be evaluated in the current context" occurs when a calculated column’s value is being referenced inside a measure without the correct row context. Use RELATED() to obtain values from another table in a related manner or write your calculation as an iterator function e.g. SUMX.
The message "Function X expects a parameter that is of table type" indicates that you supplied a column when you were expected to supply a table. To correct this error, wrap the column reference in either VALUES() or FILTER() to convert it to a table.
A measure may return BLANK when you expect a value. If the filter context eliminates all rows in the measure, this can happen. You can use the function IF(ISBLANK([Measure]),0,[Measure]) to handle cases where the measure returns a BLANK value or verify that your relationships are complete.
You may see incorrect total values in the matrix visual. One reason for this could be that your measure is aggregating the appropriate row level.
Even correct DAX can make your reports slow if not written efficiently. Follow this checklist when writing DAX for large datasets:
| Best Practice | Why It Matters |
| Use Measures over Calculated Columns | Measures compute on demand and don't increase file size |
| Use VAR to store repeated expressions | Prevents Power BI from running the same calculation multiple times |
| Avoid using FILTER() inside CALCULATE when possible | Use a direct column filter instead — it's significantly faster |
| Don't use calculated columns for aggregations | That's what measures are for; columns bloat your model |
| Minimize use of nested iterator functions | SUMX inside SUMX is expensive; simplify where possible |
| Use DIVIDE() instead of "/" for division | DIVIDE handles divide-by-zero errors gracefully without extra IF logic |
| Keep your date table clean and marked | Time intelligence functions require a proper, contiguous date table marked as a Date Table in Power BI |
The power of DAX lies in its ability to perform advanced data analytical functions that allow for real-time calculations and connect seamlessly with Microsoft systems. It helps you to make complex datamodels simple to understand while providing improved readability, flexibility and performance of your reports.
Though DAX has great capabilities, many beginners struggle with using DAX due to being first time users who need to learn how to understand the way filters and filter context work. Furthermore, performance optimization and error checking in your formulas will be very difficult if you are working on large datasets using advanced formulas.
Here are the key differences between DAX and Excel.
| Feature | Excel Formulas | DAX (Power BI) |
| Data structure | Cell-based calculations | Column-based calculations |
| References | Uses cell references (A1, B2) | No individual cells; works on entire columns |
| Formula behavior | Mostly static unless recalculated | Dynamic, recalculates based on filter context |
| Calculation scope | Limited to the active sheet | Works across the entire data model |
| User interaction | Changes require manual edits | Automatically responds to slicers and filters |
| Primary use case | Spreadsheets and small datasets | Data modeling and analytics in Power BI |
Both DAX and SQL are essential data languages, but they operate in different domains. You have to know this difference before choosing one of them. Let’s go through the key differences.
| Basis of Comparison | DAX | SQL |
|---|---|---|
| Where it is used | Used inside Power BI and tabular data models | Used inside relational databases like SQL Server or MySQL |
| Main purpose | Creates calculations and business metrics for reports | Retrieves, filters, and manipulates data from databases |
| How it works | Works on an already built data model | Works directly on raw database tables |
| Calculation behavior | Automatically updates when users apply slicers or filters | Runs when a query is executed; does not auto-adjust to report interactions |
| Relationships | Uses predefined model relationships in Power BI | Uses JOIN statements to connect tables |
| Aggregation style | Aggregations change based on filter context | Aggregations are defined explicitly using GROUP BY |
| Interaction level | Designed for interactive dashboards | Designed for backend querying and data preparation |
| Performance engine | Runs on the Power BI tabular engine (VertiPaq or DirectQuery) | Runs on a database engine with its own optimizer |
| Skill focus | Requires understanding of filter context and row context | Requires understanding of relational database logic |
A question almost every beginner asks is: "Should I clean and transform my data in Power Query or write a DAX formula for it?" The answer depends on what you're trying to do.
| Basis | Power Query (M Language) | DAX |
| When it runs | At data refresh time, before the model loads | At query time, when a user interacts with a visual |
| Best used for | Cleaning raw data — removing columns, renaming headers, splitting fields, merging tables | Creating calculations and metrics on already-loaded, clean data |
| Output | Shapes the tables that load into your model | Creates measures, columns, and tables on top of your model |
| Performance impact | Runs once at refresh; doesn't affect report interaction speed | Runs every time a filter changes; poor DAX slows down reports |
| Difficulty | Easier for data cleaning tasks | Requires understanding of filter and row context |
DAX is not only a technical tool; it is a tool that allows you to make data-driven business decisions across multiple industries:
Analysts can use DAX to produce Profit-and-Loss reports, compare Actual vs Budget, develop Running Total calculations and model Cash Flow trends and forecasts. Frequently used financial reporting calculations consist of the use of TOTALYTD and SAMEPERIODLASTYEAR.
Retailers can use DAX to evaluate their sales across geographic regions, calculate their inventory turnover ratio, analyze how much each customer's shopping cart contains and create customer segments based on their purchasing behavior using RANKX and CALCULATE functions.
Human Resources departments use DAX to create reporting dashboards that help them monitor their workforce over time and, additionally track turnover, average length of employment, and trends in the hiring across departments of an entire organisation.
Healthcare providers typically use DAX to assist them in evaluating patient outcomes, tracking Key performance indicators such as bed occupancy rates, and comparing departments within hospitals using time-related functions.
Marketers can use DAX to evaluate the success of individual marketing campaigns, calculate sales conversion rates for the various channels that they advertise in and measure both month-over-month increases in customer leads and revenue.
DAX plays a crucial role in turning raw data into meaningful insights in Power BI. By understanding its core function types and how they work together, you can build dynamic calculations that respond to user interactions and real business needs. With regular practice, DAX becomes an essential skill for creating accurate, flexible, and insightful Power BI reports.
DAX is primarily used to create custom calculations, such as totals, percentages, time-based metrics, and KPIs, that automatically update based on filters and user interactions.
DAX works in Power BI by evaluating data based on the current filter and row context. When users interact with visuals or slicers, DAX formulas recalculate results dynamically to reflect those selections.
DAX is easy to start with if you understand basic Power BI concepts. It may feel challenging at first, but learning core functions and practice makes it manageable.
Excel formulas work on individual cells, while DAX works on columns and tables and recalculates results dynamically based on filter context in Power BI.
DAX is better for difficult data modeling in Power BI, while Excel is ideal for simple analysis and fast calculations.