Business data gets a new layer of complication with every day that passes by. This advancing complicatedness demands advanced methods that are not offered by traditional data analysis tools and methods. Different AI tools harness the power of deep learning and machine learning algorithms for extracting concentrated insights, uncovering hidden patterns, automating repetitive tasks and more. Data analysts use these tools, technologies and methods while tackling complicated problems.
"According to research from the Bureau of Labor Statistics, computer and IT jobs are expected to grow much faster than average from 2023 to 2033, with a projected 356,700 job openings annually."
It is important to know what is data analysis before diving into its top tools for the coming years. It is an important part of the modern decision processes ranging amongst different sectors and domains. Businesses adopt this practice because of the increasing need to correctly use data. It includes many different steps that each holds a good amount of necessity.
328.77 million terabytes of data is being created every single day. All this data is also made readily available to most businesses but not all of them are able to use it efficiently. This highlights the need for dependable and approachable data analysis tools.
Data analysis tools are different software platforms for processing, analyzing and visualizing humongous data sets. The reason behind this is extracting highly meaningful and concentrated insights to support good business decisions. There are different tools that have different uses and applications. These tools manipulate data, create predictive models, easily represent findings, perform statistical analyses and do many more things.
Explore igmGuru's Data Science with Python Training Course Online for Career Upliftment.
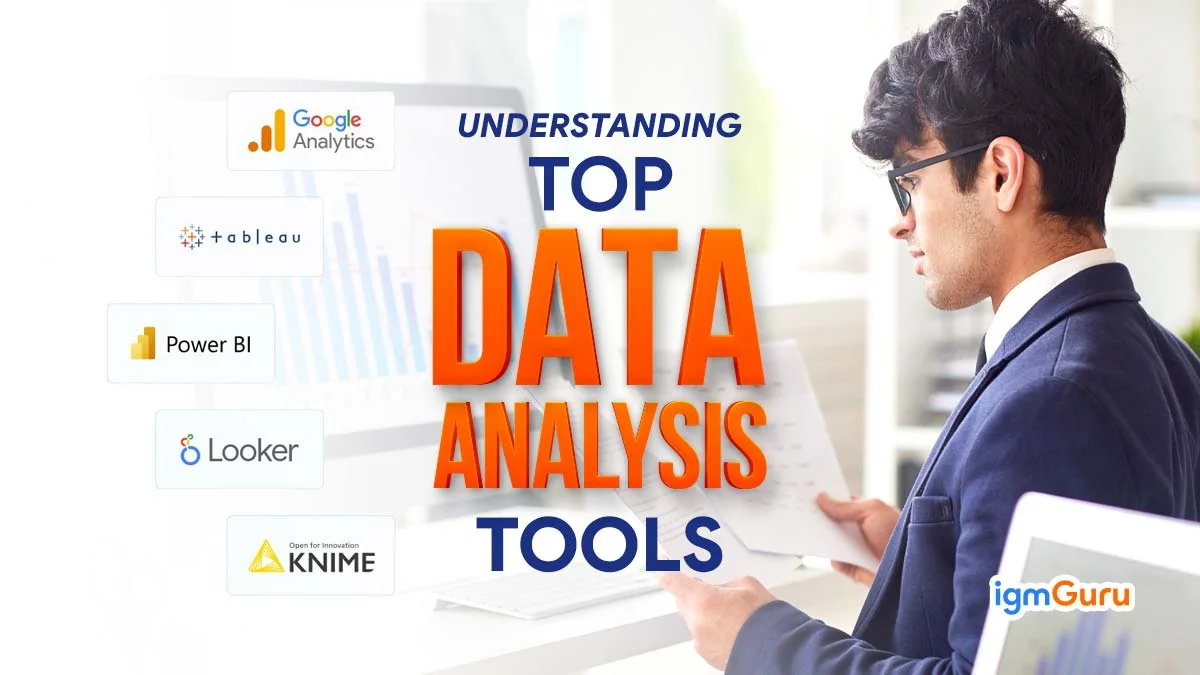
There is no dearth of good data analysis tools in the market. But that does not mean that every tool is a good fit for every business and in every scenario. Data analysts have to learn and understand different tools, along with the where and when of their use. This list contains the top names that are highly useful today and will continue to be in the coming years too.
Tableau is a very powerful and rapidly-growing data visualization tool with high usage in business intelligence. It simplifies raw data to visually represent it into a super easy-to-understand format. Tableau makes this process easier with visualizations through worksheets and dashboards. It is very useful for managing operations, inventory and supply chain, while tracking marketing and sales performance.
Power BI is a business analytics tool by Microsoft. It has many different highly dynamic functionalities for visualizations and BI. Its user-friendly interface lets end users generate dashboards and reports with ease and less effort. This makes data exploration and insight accumulation simpler. It is useful in analyzing financial performance, human resources and operations workforce.
Related Article - Here is a step-by-step guide on how to create dashboard in Power BI.
Python is a known general purpose programming language with an interpretative and flexible nature. It is as popular amongst beginners as it is amongst experienced developers. Its adaptability and simplicity make it favorable for machine learning, automation, web app creation, data analysis and so much more. It is a multi-utility language that different industries and professionals use to the fullest.
QlikView is a software for BI and data visualization that efficiently transforms raw data into valuable and actionable knowledge. It has an associative data indexing engine for revealing connections and insights throughout different data sources. Users easily explore and analyze data deeply for uncovering hidden relationships and patterns. Such discoveries lead to better decisions for the business and strong strategies. Business performance can be monitored in real time.
Excel is a part of the Microsoft Office Suite that works as a spreadsheet app. It has different functionalities for graphing, pivot tables, calculations and others. Excel handles different data processing requirements along with extensive visualization and data analysis adoption. It tracks and plans projects, supports financial reporting and analysis, tracks and manages inventory, and does much more.
Explore igmGuru's Microsoft Advanced Excel Training Course to gain high-level expertise.
Jupyter Notebook is a web application for creating and sharing documents that have equations, explanatory text, live code and visualizations. This free web app is majorly used for tasks like numerical simulations, ML, statistical modeling, and cleaning and transforming data.
Looker is an exceptionally powerful and globally used big data analytics and BI solution. It simplifies different processes like analyzing, sharing and exploring business insights in real time. Looker connects flawlessly with different warehouses or SQL databases to directly work with the database in real time. It gets the process of switching data into actionable insights in line. This leads to easy accessing of business analytics for better decision quality.
TensorFlow is a known open source software library for neural network research, machine learning, high performing numerical computation and much more. It has a flexible architecture for easy computation deployment throughout different platforms like GPUs, TPUs and CPUs. It is also a popular pick for text-based applications like sentiment analysis and language translation.
Microsoft Azure is a cloud computing platform for deploying, creating, managing and testing services and applications. It does so through Microsoft-managed data centers. Azure has different solutions like SaaS, IaaS, PaaS and others too. It supports many different tools, frameworks, programming languages and technologies.
Splunk is a platform for searching, visualizing and analyzing machine-generated data that is collected from different devices, apps, websites and devices. This data could also be generated from various business operations and IT infrastructure. It manages applications for high level compliance and security while conducting web and business analytics.
MongoDB is an open source database for easy scaling and development. It does not use tables and rows but rather works with collections and documents, along with a flexible schema for storing data in JSON-like documents. It builds web services and applications along with processing and storing big data.
There is no dearth of impressive and impeccable data analysis tools in the market these days. But just being out there is not a guarantee of being useful or versatile. This article has a compiled list of the top tools in this field for 2026 and beyond. There are many more tools that are equally useful and can be explored for becoming a true professional in the field.
Learning about the different tools for this practice is a good choice because of the changing demand and AI usage.
The future trends around these tools involve the inclusion of artificial intelligence, quantum computing, machine learning and deep learning.
The demand for professionals in this area is skyrocketing in mostly all top domains and industries. The same trends are expected to continue in 2026 too.
Couse Schedule
| Course Name | Batch Type | Details |
| Business intelligence Courses | Every Weekday | View Details |
| Business intelligence Courses | Every Weekend | View Details |