To prepare for R programming interviews you will need to have much more than just an understanding of syntax; you need to have a good understanding of manipulating data, statistical thought and how to solve problems that occur in the real world.
As someone who has 4+ experience using R programming I am concerned about how candidates will use basic concepts such as Data Frames, vectorization and the use of packages like ‘dplyr’ and ‘ggplot2’.
This guide to R Programming Interview Questions will prepare you to provide a strong explanation of the core components, demonstrate an ability to write efficient code and illustrate that you are capable of strong analytical thinking. It does not matter if you are an entry-level individual or a highly experienced individual, mastering the questions contained here will help you stand out and demonstrate your ability to manipulate data.
The following are some R programming interview questions that are specially designed to check if the candidate has basic knowledge of R programming:
R programming is a free open-source programming language and software environment designed specifically for statistical computing, data analysis and data visualization. Data scientists, researchers and statisticians in academia and industry mostly use it. It has various characteristics, but the most common ones are:
If we compare R to other programming languages, then it has the following limitations:
Here are some of the basic data types in R:
The main data structures in R that are widely used for organizing and handling data efficiently are designed for specific types of data storage and analysis tasks. Here are some of them:
Here are some common ways to import data in R from different file formats, which is an essential step before performing any data analysis or visualization tasks.
An R package is a collection of functions, datasets and documentation that extends R’s capabilities. You can install a package using install.packages("ggplot2") and load it using library(ggplot2).
For example, ggplot2 helps create advanced and visually appealing data visualizations in R.
We can add a new column to a dataframe using the $ operator. For example:
|
This assigns values to a new column in the data frame.
RStudio is an integrated development environment for R. It provides a user-friendly interface with features like a code editor, console, debugging tools and visualization panels, which make coding and data analysis more efficient.
We can remove a column by assigning it NULL, like df$column_name <- NULL. Another way is by using indexing, such as df <- df[, -column_index] to exclude specific columns.
A factor in R is used to represent categorical data. It stores data as levels, which is useful for statistical analysis and modeling, especially when working with grouped or classification data
Read Also: R Programming Tutorial
Following the most asked R Programming interview questions and answers for intermediate professionals:
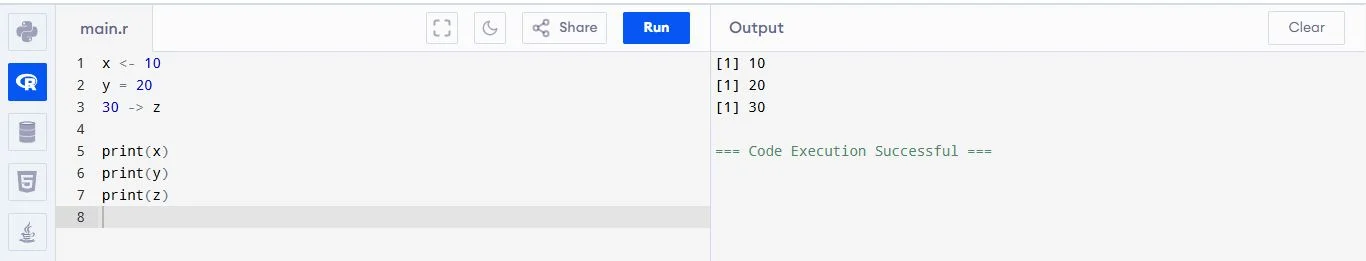
In R, variables are assigned using <-, = or ->. The <- operator is most commonly used as it improves readability. It assigns values right to left. Variables store different data types like numbers, strings or vectors for later use.
For example:
|
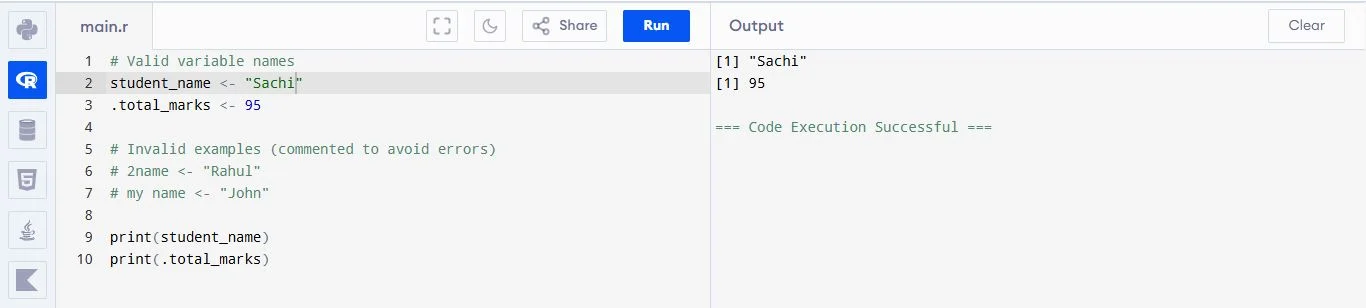
Following are some of the standard naming rules and best practices that help avoid errors and make your code easier to understand, especially when working on large projects or collaborating with others.
For example:
|
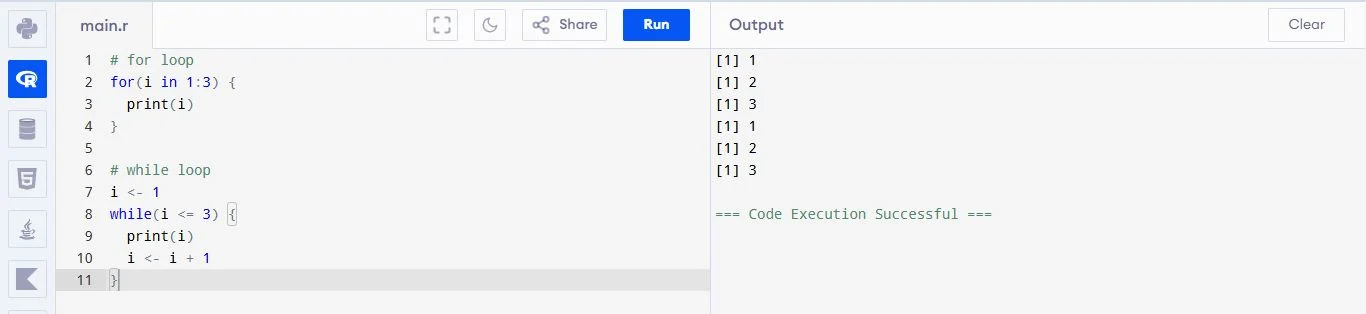
R supports for, while and repeat loops. A for loop iterates over a sequence, while runs based on a condition and repeat runs indefinitely until stopped. Loops help automate repetitive tasks like calculations or printing sequences.
For example:
|
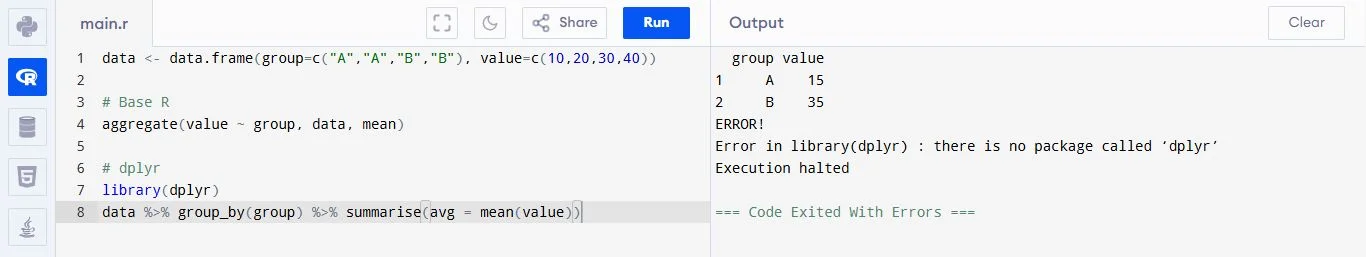
Aggregation means summarizing data, like finding average or total for groups. In base R, we use aggregate(). In dplyr, we use group_by() and summarise(). It helps understand data better by grouping values.
For example:
|
Merging means combining two datasets using a common column, like an ID. In R, we can use merge() in base R or join functions like inner_join(), left_join() in dplyr. It is helpful when we have related data stored in different tables and want to combine them. For example, joining customer details with their orders to get a complete view for analysis.
String concatenation means joining multiple text values into one string. In R, we use functions like paste() and paste0(). The difference is that paste() adds space by default, while paste0() joins without space. It is useful when creating messages, combining names or formatting output. This is commonly used in reporting and data processing where we need to generate readable text.
Transposing means converting rows into columns and columns into rows. In R, we use the t() function to do this. It is useful when we want to change the structure of data for analysis or visualization. For example, sometimes data is easier to understand or process when rows and columns are swapped. It is commonly used in matrix operations and data preparation.
Chaining means performing multiple operations step by step in a clean and readable way. In R, we use the pipe operator %>% from dplyr to pass the result of one step to the next. This avoids writing deeply nested code and makes it easier to understand. It is very useful in data cleaning and transformation tasks where multiple steps like filtering, selecting and modifying data are required.
R allows us to create many types of visualizations like bar charts, line graphs, histograms, scatter plots and box plots. Base R provides simple plotting functions, while ggplot2 offers more advanced and customizable visualizations. These charts help understand data patterns, trends and relationships. Visualization is important in data analysis because it makes complex data easy to understand and present clearly.
In R, next and break are used to control loops. The next statement skips the current iteration and moves to the next loop cycle, while break stops the loop completely. These are useful when handling conditions inside loops, such as skipping unwanted values or exiting early when a condition is met. They help in writing efficient and controlled loop logic during programming.
Read Also: R Programming Quiz
Here are the most asked R Programming interview questions and answers for experienced professionals. These will help candidates with 4+ years of experience.
You can create a new column using values from existing columns. For example, you can add, subtract, or multiply columns and store the result in a new column. This is useful when you want to create new information from old data. It helps in better analysis and preparing data for models.
To change a text date into a real date, you can use functions like as.Date(). You just need to tell R the date format. This helps R understand the date correctly. It is useful when working with time data like sorting dates or finding differences between dates.
Lazy evaluation means R only calculates something when it is needed. If a value is not used, R will not calculate it. This saves time and improves performance. But sometimes it can be confusing because values are not created immediately when the function is called.
In R, each of the array apply family functions allows you to operate on arrays of data without having to loop through them. Thus, they enable you to write cleaner, quicker code. Each of the apply family functions applies its operation to specified data types and returns the result back in a specified format.
| Features | apply() | lapply() | sapply() | tapply() |
| Purpose | Apply function on rows/columns | Apply function on each element | Same as lapply but simpler output | Apply function on grouped data |
| Data Type | Matrix or Array | List or Vector | List or Vector | Vector with grouping factor |
| Output | Vector or Matrix | List | Vector or Matrix | Vector or Array |
| Working | Works on rows (1) or columns (2) | Works element-wise | Works element-wise | Works group-wise |
| Simplicity | Medium | Simple | More user-friendly | Complex |
| Example Use | Sum of rows | Square list values | Mean of values (simple output) | Average by group |
To make R faster, avoid loops and use vector operations. Use packages like data.table for quick data handling. You can also use parallel processing to perform tasks at the same time. Cleaning memory and removing unused data also helps improve speed.
Regular expressions are patterns used to find or change text. In R, functions like grep() and gsub() are used. They help you search, replace, or clean text data. For example, finding numbers or removing extra spaces from text.
Some common machine learning packages in R are caret, randomForest and e1071. These help you build models easily. They provide tools for training, testing and improving models. They support tasks like prediction, classification and clustering.
Feature selection means choosing the most important columns for a model. You can use methods like checking correlation or using model importance. Packages like caret help in this process. It makes the model faster, simpler and more accurate.
Correlation shows how strongly two variables are related. Covariance shows how they change together. In R, you can use cor() and cov() functions. Correlation is easier to understand because its value is always between -1 and 1.
Model accuracy tells how well your model works. You can use methods like train-test split or cross-validation. Common metrics are accuracy, precision, recall and RMSE. These help check if the model gives correct results on new data.
Read Also: Python Interview Questions and Answers
Scenario-based R programming interview questions test how well you can apply your knowledge in real-life situations. They focus on problem-solving, decision-making and practical use of R for data analysis, automation and building efficient solutions in different scenarios.
I would use AI or LLM tools to automate repetitive tasks like data cleaning, code writing and report generation. For example, AI can suggest ways to handle missing values or generate model code. I would first automate data preprocessing and reporting because they take the most time. This helps improve efficiency, reduce manual errors and allows me to focus more on analysis and decision-making.
I would build an AutoML pipeline using packages like caret or mlr3, which can automatically select the best model and tune parameters. This is helpful for teams with less expertise because it simplifies the process. The main advantage is speed and ease of use, but the downside is less control over the model and sometimes lower understanding of how the model works internally.
I would create a simple and user-friendly dashboard using Shiny or Plotly. I would include filters, dropdowns and clear visualizations so users can interact with the data easily. The focus would be on clean design and simplicity. This allows non-technical users to explore insights without coding and helps them make better decisions based on real-time data.
I would optimize performance by using efficient packages like data.table and replacing loops with vectorized operations. I would also apply parallel processing to speed up execution. Additionally, I would use profiling tools to identify slow parts of the code and remove unnecessary steps. These improvements help reduce runtime and ensure timely project completion.
I would deploy R on AWS using EC2 or integrate it with Spark using sparklyr for large-scale data processing. I would manage environments using Docker for consistency. This setup allows scalability and flexibility. Challenges may include setup complexity, cost management and maintaining consistent environments. Proper monitoring and automation are important for smooth operations.
I would design a workflow where Python handles machine learning tasks and R is used for statistical analysis and visualization. I would connect both using tools like reticulate or APIs. This allows us to use the strengths of each language. It improves efficiency, flexibility and ensures that each task is handled by the most suitable tool.
I would use tools like renv to lock package versions and create a consistent environment for all team members. This ensures everyone uses the same dependencies. I would also maintain a shared configuration file and document setup steps. This approach improves reproducibility, avoids compatibility issues and ensures consistent results across different systems and team members.
I would create a Shiny application with a simple interface where users can upload data and use buttons or filters to analyze it. The app would include predefined analysis options and visualizations. This removes the need for coding and makes data exploration easy. It helps non-technical users generate insights independently and supports faster decision-making.
R is suitable because it has strong statistical capabilities and reliable packages used in healthcare. To ensure accuracy, I would carefully clean and validate the data, use trusted libraries and document every step. I would also test results and cross-check outputs. This ensures reliability, reproducibility and compliance with industry standards.
I would use R Markdown or Quarto to create dynamic reports that combine code, results and explanations. These reports automatically update when data changes. I would also schedule them to run regularly. This ensures consistency, saves time and reduces manual effort. It also makes reports reproducible and easy to share with stakeholders.
In this blog, I have compiled interview questions and answers that cover every stage of skill- beginner, intermediate, experienced. This guide will assist you in preparing for a future interview and enhance your current industry knowledge base. Attend as many interviews as possible so you can learn something new each time you attend and gain confidence in your ability to acquire the position.
R is mainly built for statistics and data analysis, so it has many tools for graphs and statistical tests. Python is more general-purpose and is used in many areas like web development, AI and automation.
Yes, R can be used for machine learning using packages like caret and randomForest. It can also be used in production, but it is less common than Python for large-scale applications.
With regular practice and consistency, you can learn it in 2 to 3 weeks.