Pandas is a powerful Python library used for data-related tasks like data manipulation and analysis. It can manage any type of data format, even tabular data. Think of it as a data therapist, waiting to receive your messy tables and magically turn them all into organized ones. Isn't it amazing? Let's understand what is Pandas and how to use it for data analysis with this comprehensive guide.
Pandas is an open-source library for the Python programming language that makes data analysis and manipulation simpler. You get a number of data structures like Series (one-dimensional labeled arrays) and DataFrame (two-dimensional tables like spreadsheets). All of that comes along with some other operations to easily read, transform, aggregate and analyze data.
Let me give you a more fun and real-life analogy to understand it even better. You can picture Pandas as that one organized friend at a messy party. Everyone else would be juggling with plates, while this one friend would neatly line up everything so that you can finally see what you've got. This Python library gives you all the tools you need to pick, group, merge, reshape or reorder columns.
Read Also: Pandas Interview Questions And Answers
Let me take you back to 2008 to take a glance at the history of Pandas. Wes McKinney, an American software developer at AQR Capital Management, got frustrated with limited data analysis tools. These tools were either too low-level or hard to use when handling real-time data. He decided to come up with something to fill this gap and invented Pandas. I have created a table for you to understand the evolution of this open-source Python library-
| YEAR | EVENT |
| 2009 | Pandas was made open-source for the community to use, contribute and help it grow. |
| 2012 | The Python library gained more relevance with the release of the first edition of Python for data analysis. |
| 2015 | It became a sponsored project of NumFOCUS, a non-profit supporting open source scientific computing. |
| 2018 | First- in-person core developer sprint |
In this, I will explain how Pandas works through describing its core ideas. Here are some:
This open-source Python library is built on top of NumPy, which means that it uses NumPy's fast system for doing basic math and storing numbers. More tools are added by Pandas like labels for rows/columns, handling mixed data, and tools to easily shape and clean the data.
The main Pandas data structures include series and DataFrames -
Data is automatically aligned based on labels in Pandas. For example, it lines up the indices of series before doing element-wise operations when you add two series together. It does that irrespective of different colors, orders or missing labels. It handles times/timestamps with ease through specialized index types like PeriodIndex, DatetimeIndex, etc.
Many important operations like grouping, filtering, sorting, reshaping, etc, are supported by this open-source Python library. All that a user needs to do is write a high-level command. For example, 'give me the average sales by region' and Pandas would handle the rest of the details.
Parts of Pandas are written in Cython or other compiled lower-level languages. This is done to speed up the critical operations. It helps in compensating for Python's slowness when it comes to loops. DataFrame's data are stored in blocks or arrays (usually in contiguous memory). This means that operations performed on rows and columns are much faster than doing work on each element individually in Python.
It is used for efficient data cleaning, manipulation, and analysis in Python. It provides powerful tools to handle structured data easily with minimal code. Let's have a look at the benefits of using it.
It is easier to handle and analyze large datasets with the data structures offered by Pandas. Tasks like filtering, grouping, and aggregating data are all performed smoothly as these data structures allow for quick data manipulation.
Pandas allows you to perform complicated data operations with a little code due to its user-friendly syntax. This simplicity speeds up the data analysis process and makes it accessible even to those new to programming.
A number of data operations are supported by Pandas, including merging, reshaping, and time series analysis. It also offers robust handling of missing data, ensuring that your analyses are both accurate and reliable.
As part of the broader Python data science ecosystem, Pandas integrates seamlessly with libraries like NumPy, Matplotlib, and Scikit-learn. This compatibility allows for a smooth workflow from data manipulation to visualization and machine learning.
Pandas is an open-source library with a large and active community of developers. This ensures continuous improvements, a wealth of learning resources, and robust support through forums and documentation.
Here are the applications of Pandas-
Analysts use Pandas to work with time-series data: stock prices, trading volumes, returns, moving averages, and risk metrics. It helps in cleaning up financial data (for example, correcting dates, handling missing trading days), then doing aggregations, merging datasets (e.g., multiple asset classes) and modeling.
Pandas helps analyze patient records, clinical trial data, medical devices' sensor logs, etc. For example: handling missing or corrupted entries, transforming data (dates, units), aggregating results by treatment group, exploring trends in disease outbreaks or treatment outcomes.
Journalists and analysts often get raw data (surveys, spreadsheets, public datasets) that are messy. Pandas makes it possible to clean up, reshape (pivot, melt), aggregate, and then create the summary stats and visuals needed for reports.
Internal dashboards, KPIs, forecasting: e.g., sales forecasting, inventory planning, operations metrics. Pandas helps in pulling data from different sources (Excel, databases), cleaning, calculating metrics, and producing charts/reports for stakeholders.
For experiments, simulations, social science surveys, etc., researchers use Pandas for preprocessing data, statistical summaries, combining data from various sources, and visualizing results. Because it's Python-based, it integrates smoothly with libraries like NumPy, SciPy, and Matplotlib for deeper analyses.
Once the Pandas module is installed and running, you can load your data into a DataFrame or Series, then tap into Pandas' wide range of tools to clean, reshape, and analyze it. Some of its core capabilities include:
This open-source Python library gives you methods to fix messy data, fill in missing values, drop rows or columns, remove nulls, and rename columns.
You can filter and select exactly what you want using detailed conditions. No matter how complex your data is, you can pinpoint the rows or columns you need.
It supports operations like groupby, pivot, and merge so you can summarize and reorganize your data in meaningful ways.
Pandas works well with Matplotlib (and other plotting libraries), so you can turn your data into charts and graphs right from the DataFrame.
Now, I will teach you how to get started with Pandas through practical steps-
Installing Pandas in your system is quite easy if you already have PIP and Python installed in it. Use this command to install it-
| C:\Users\Your Name>pip install pandas |
The second step involves importing Pandas in your applications by adding the import keyword once you are done with the installation-
| import pandas |
Congratulations, you are all set to use Pandas-
import pandas as pd mydataset = { 'dishes': ["Pasta", "Omelette", "Curry"], 'plates': [3, 7, 2] } myvar = pd.DataFrame(mydataset) print(myvar) |
This is what your output would look like once you run the code-
Dishes plates 0 Pasta 3 1 Omelet 7 2 Curry 2 |
This open-source Python library provides two primary data structures, Series (one-dimensional) and DataFrame (two-dimensional), for efficient data manipulation and analysis. Let's discuss them.
This data structure is capable of holding any data type, including strings, integers, Python objects, etc. The axis labels are collectively called the 'index'. Some of its main features include Labeled Index (each element is associated with a label) and Homogeneous Data (all elements in a series consist of the same data type).
Example
Here is an example for you-
import pandas as pd data = [10, 20, 30, 40, 50] s = pd.Series(data, index=['a', 'b', 'c', 'd', 'e']) print(s) |
Output
This is your output-
a 10 b 20 c 30 d 40 e 50 dtype: int64 |
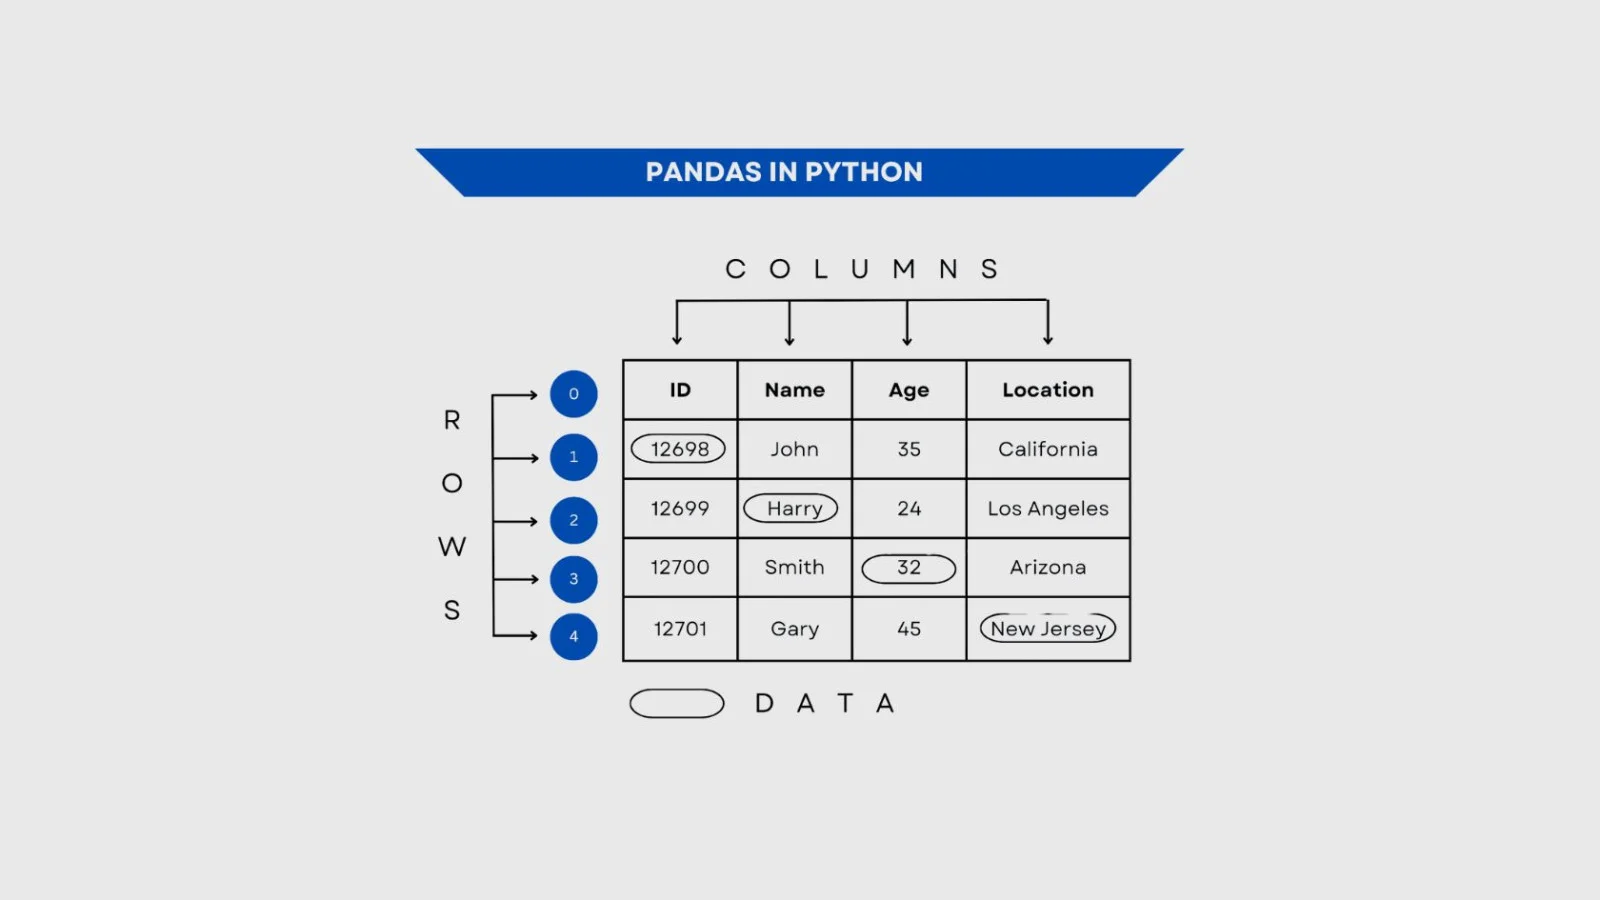
A DataFrame in this open-source Python library is kind of similar to a SQL table or spreadsheet. It is a two-dimensional labeled data structure with columns of potentially different types. The key features include Heterogeneous Data (each column can contain different data types) and Labeled Rows/Columns for easy data manipulation.
Example
Here is an example-
import pandas as pd data = { 'Name': ['Anjali', 'Garvita', 'Siddhi'], 'Age': [25, 30, 35], 'City': ['Ajmer', 'Jaipur', 'Udaipur'] } df = pd.DataFrame(data) print(df) |
Output
This is your output-
Name Age City 0 Anjali 25 Ajmer 1 Garvita 30 Jaipur 2 Siddhi 35 Udaipur |
The Index in Pandas is like a fixed list of labels that name the rows or columns in a series or DataFrame. It helps with fast lookup and aligning data accurately, as it cannot be changed by normal operations. The main features include Hashable (Labels can be integers, strings or any other hashable types) and Unique Labels (Every label is unique, ensuring data is aligned properly).
Example
Here is an example-
import pandas as pd data = [10, 20, 30, 40, 50] index = ['a', 'b', 'c', 'd', 'e'] s = pd.Series(data, index=index) print(s.index) |
Output
Here is your output-
| Index(['a', 'b', 'c', 'd', 'e'], dtype='object') |
This Python library is widely used for data analysis due to its flexibility and ease of use. However, like any tool, it has both advantages and drawbacks that users should consider.
| PROS | CONS |
| Flexible operations for filtering, reshaping, merging, aggregating, etc. | High memory usage, especially with large datasets or poor data types. |
| Integrates well with the rest of the Python data stack (NumPy, Matplotlib, SciPy, etc.). | Limited built-in support for distributed computing / very large-scale workflows. |
| Powerful data structures (Series, DataFrame) that make data manipulation and analysis easier. | Slower performance for very large datasets; not optimized for multi-core out of the box. |
| Easy handling of missing data, duplicates, and data cleaning. | Steeper learning curve for advanced features; complexity when optimizing memory or performance. |
Pandas has firmly established itself as an indispensable tool in the Python data ecosystem, providing intuitive, high-performance data structures and powerful operations for manipulating, cleaning, and analyzing structured data. Whether you're dealing with CSV files, time series, or relational data, Pandas' rich API and interoperability with libraries like NumPy and Matplotlib make it an ideal choice for data scientists and analysts alike.
Categorical dtypes are special types for columns that have a limited set of possible values (like “Yes/No”, “Red/Green/Blue”, etc.). Using them can save memory and speed up operations like grouping or value counting.
You can read data in chunks (using the chunksize parameter) instead of loading it all at once. Convert columns to more memory-efficient types (e.g., from object/string to categorical, or downcast numeric typ
Course Schedule
| Course Name | Batch Type | Details |
| Data Science Courses | Every Weekday | View Details |
| Data Science Courses | Every Weekend | View Details |