A lot of organizations throughout the globe revolve around data due to the value it brings to the table for business. Extracting insights out of gigantic amounts of raw data is quite impossible without great tools and platforms by one's side. This is why data visualization was introduced to simplify as well as understand hidden insights. This Qlik Sense tutorial will help you understand the use of data visualization and data analysis platform.
There are many business intelligence tools present in the market and Qlik sense is a name that's used for visualizing the data. Even in BARC's BI and Analytics Survey 23, Qlik Sense ranked #1 in performance satisfaction, dashboards and project length within its peer groups.
Therefore, learning Qlik Sense is very fruitful. This Qlik Sense tutorial will help you understand the use of data visualization and data analysis platforms. It includes essential knowledge of Qlik Sense, its capabilities, architecture, etc. Let's begin by understanding what exactly Qlik Sense is.
So, let's start with what is Qlik Sense. It is a top known and leading data analysis and visualization platform. It has a unique associative analytics engine with which it helps users in connecting and correlating insights from various sources. It also allows dynamic selections and searches. The tool throws light on data analysis via augmented graphics
Its sophisticated AI and high-performance cloud platform facilitates users to make informed decisions according to a solid foundation of data. This platform is built for executives, decision-makers and even analysts. It offers flexibility instead of a conventional query-based approach to help users navigate across data for drawing valuable insights. Its interactive features enhance the users' prowess of extracting ingenious inferences from different databases.
Explore igmGuru's Qlik Sense course program to learn data analytics from the scratch.
This Qlik Sense tutorial is apt for beginners as well as experienced professionals. It contains knowledge about its top capabilities, architecture, editions and more. It's the best way of commencing a better understanding about this platform and what it brings for organizations everywhere.
Here is a list of key capabilities:
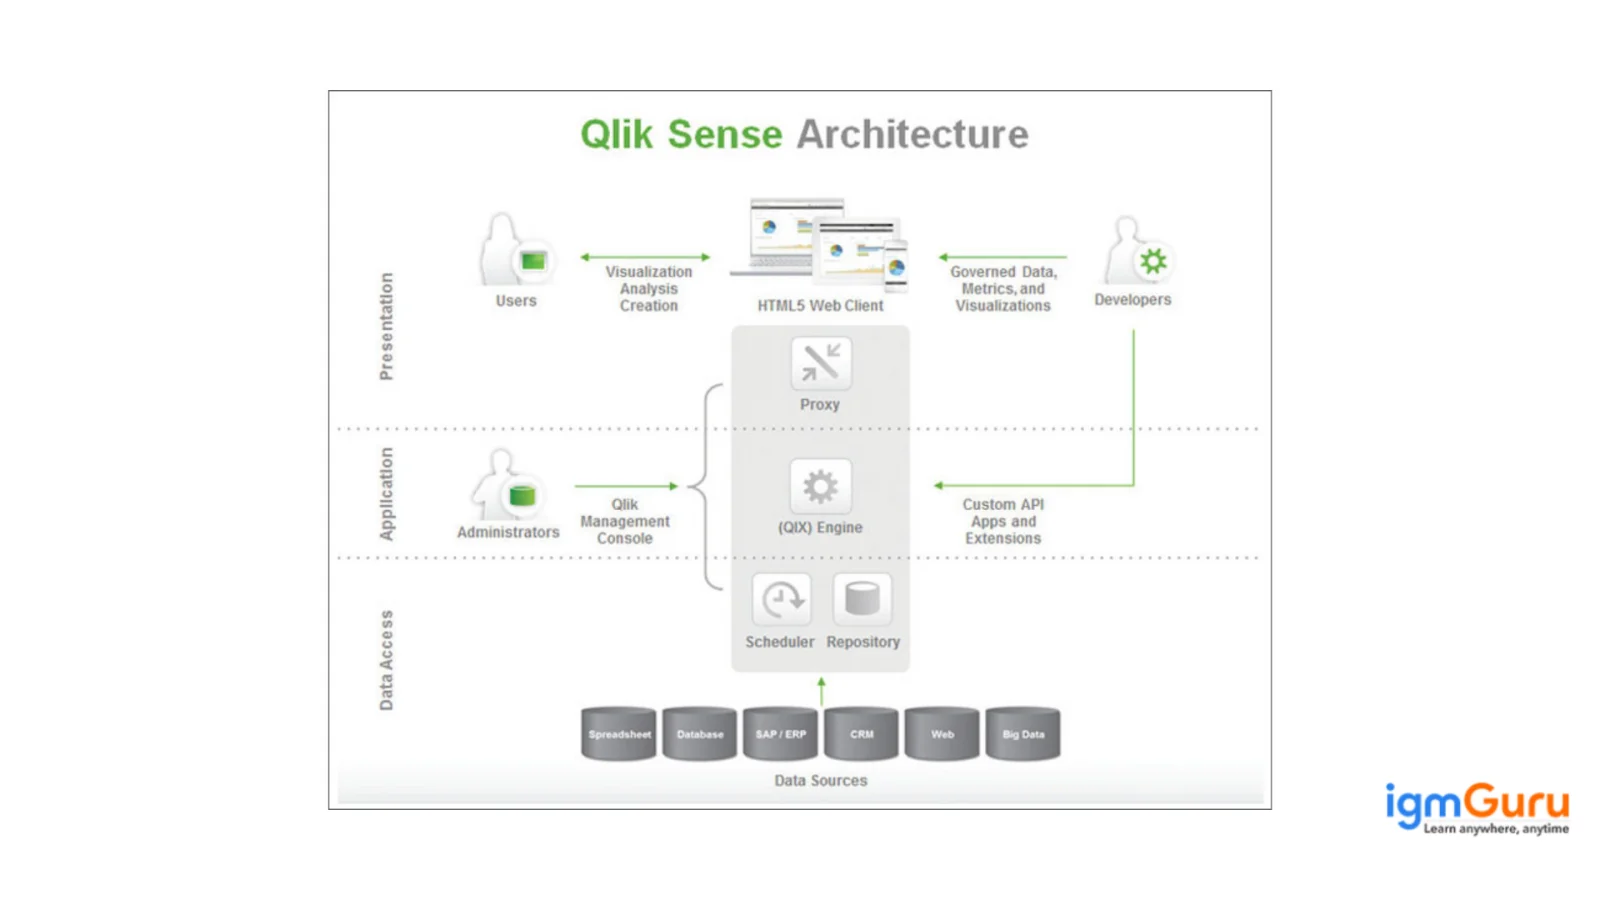
Qlik Sense Architecture offers a secure, manageable and scalable work environment for users via high-quality services. It presents high management and visual analytics tools. It comprises many components and services that work flawlessly together to bring out architecture' data management and analytics capabilities. It's flexible and easily scalable as well.
There are four key components included in its architecture. Learning about these is important to understand the architecture for optimal utilization. These are-
Related Article- Tableau Tutorial
Learning about the top architecture services helps in learning this platform in a more comprehensive manner.
This segment talks about the different types of editions of this platform. Knowing about them is extremely important for perfecting this platform. It's a widely employed platform and certainly brings about many opportunities. The understanding of these editions is beneficial for expanding career chances.
Its one of the free products that enables the user to build engaging dashboards and reports with compelling graphs and charts. It's a data visualization software that makes the path to analyzing data easier. Making more informed decisions is also rendered.
It's a cloud edition wherein the user can create as well as share apps via the cloud. Cloud edition facilitates the user to prepare and then share analytics reports with intended others. It enables the users to store gigantic amounts of data. There are two different cloud versions namely-
This version is available on a free basis which can easily be shared with the five users. It also brings in extra features as compared to the basic one. It also holds high capabilities for collaboration among groups for analyzing data.
This edition is specially designed for enterprise uses. This can be categorized as the premium version that has been especially crafted for enterprise usage. It brings along complete data analysis features. These include reporting, visualization, multi-platform cloud deployment, exploration, collaboration, data integration, scalability and enterprise governance.
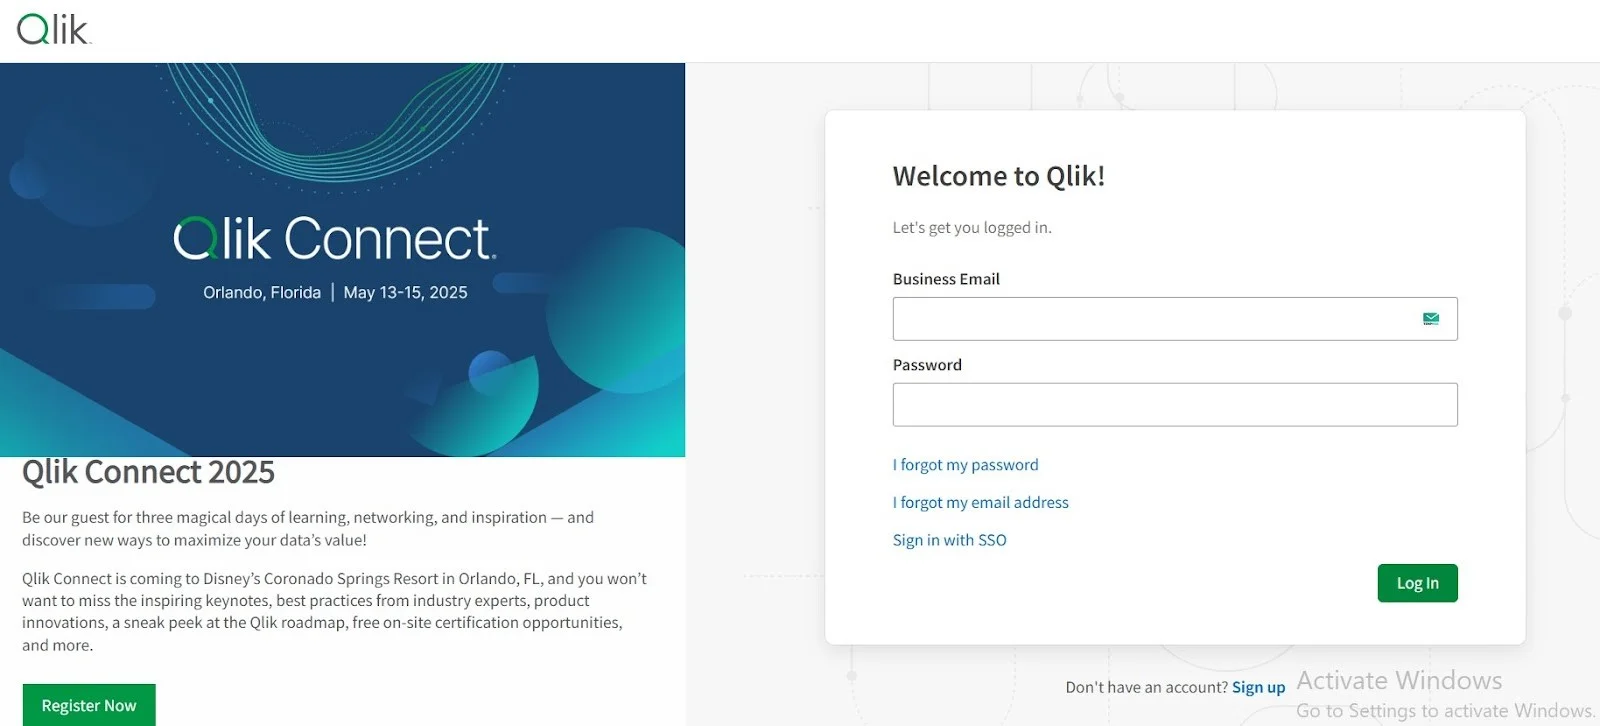
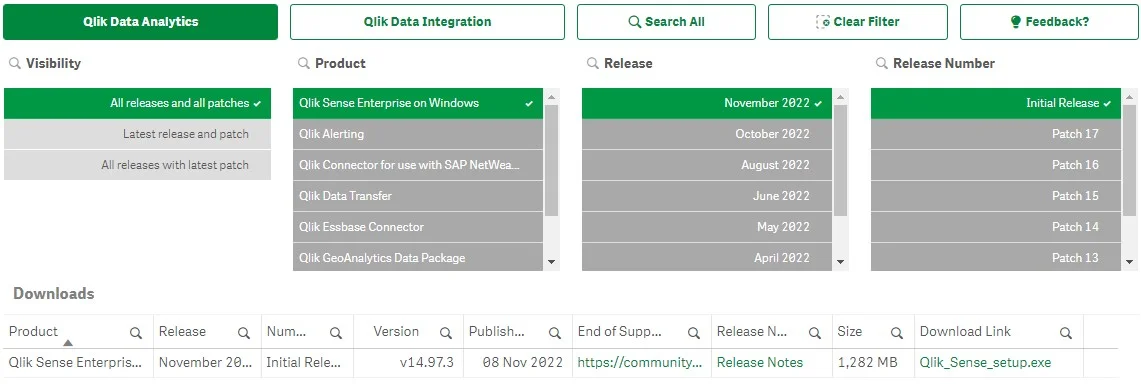
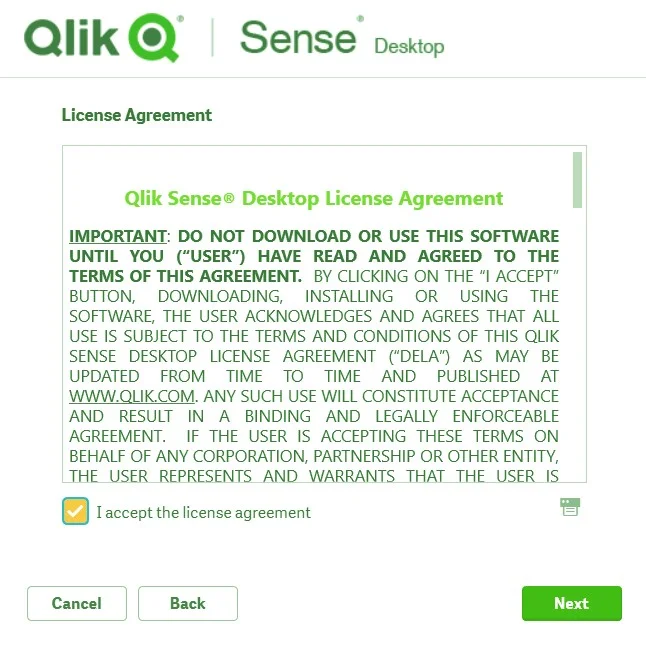
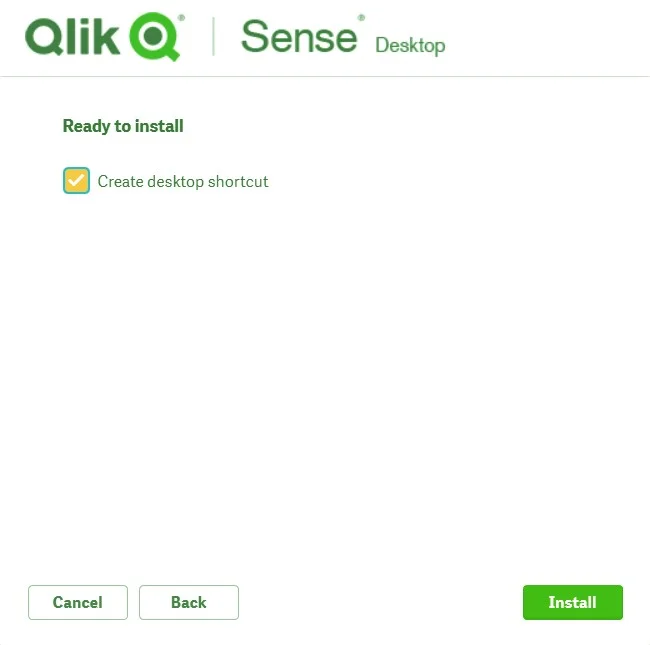
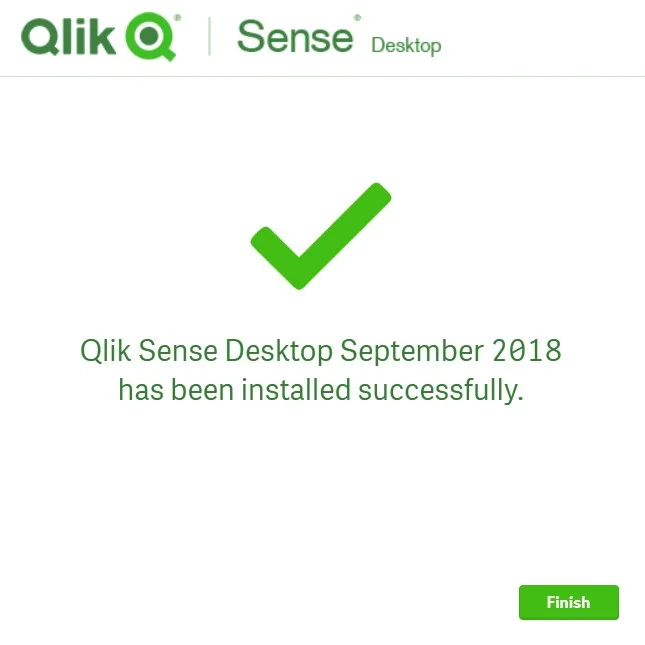
This section provides a comprehensive installation guide of this platform. It will provide learners a practical environment to immediately apply what they learn. Here they can build and explore data visualizations, reports and dashboards. This installation process involves the following steps:
Qlik Sense provides many features like self-service analytics, guided analysis and embedded AI/ML for intuitive data exploration and insight generation. It is supported by a high-speed in-memory engine (QIX Engine) and strong data integration abilities. Main features of Qlik Sense involve interactive dashboards, powerful associative data modeling, data storytelling and more. Here are the core features of Qlik Sense given below in depth.
Qlik Sense grants local support for data modeling through QlikView Scripting (QVS). This lets its users conduct advanced data changes, calculations and modeling directly in the Qlik Sense environment. Through QVS, companies can develop strong and flexible data models customized to their particular business needs, clearing the way for efficient data visualization and data analysis.
This feature offers smart, context-aware recommendations and suggestions to its users according to their data and analysis activities. It makes use of machine learning algorithms for analyzing patterns in the data and recommends applicable insights, associations and visualization to its users. This feature assists its users reveal hidden insights and trends in their data. It actively assists them through the analysis procedure and offers customized recommendations.
This falls among the hallmark features of Qlik Sense. It is far from traditional BI tools that depend on predefined hierarchies and relationships. Qlik Sense's associative data model permits an active and flexible data exploration. Its users can locate through data intuitively, making associations on the rise to reveal hidden insights and relationships in their data.
Qlik Sense provides integrated sharing and collaboration, letting its users share insights and collaborate on projects easily. Users can finely participate on apps and data visualizations in shared spaces in Qlik Sense Cloud. Same collaboration abilities are there in on-premises deployments, letting real collaboration and encouraging a culture of data based decision making all over teams.
In the center of Qlik Sense is the QIX Engive, which is a high speed, in memory engine made for fast data discovery and analysis. Using advanced indexing techniques, the QIX Engine strongly works with data points, letting its users explore connections easily. The data is stored in RAM, making sure of lightning fast data queries and visualization, even with huge datasets via in-memory processing. The engine's extensibility permits it to flawlessly manage growing data volumes while managing exceptional performance. Constant innovation makes sure that the QIX Engine stays at the forefront of data analytics technology. Running actionable insights and informed decision making for companies all over the world.
This platform gives extensive personalization choices through extensions and customized application development. Organizations can extend the functionality of Qlik Sense by making personalized extensions or applications personalized to their certain business needs. Its open API platform smoothens the development of custom solutions, letting companies to improve and extend the abilities of the platform to meet their requirements.
This platform provides embedded analytics abilities, allowing companies to flawlessly blend Qlik Sense analytics in existing applications, websites and portals. Users can access insights directly in familiar workflows, removing the requirement to switch between various tools/interfaces. This integration improves user productivity and makes decisions by giving relevant data and analytics at the point of action.
QlikView, a developer-centric tool that is made for creating highly personalized, guided and interactive applications with a focus on backend development. Whereas Qlik Sense is a user-friendly, self-service business intelligence tool for modern users. Here is a detailed comparison of Qlik Sense and QlikView in a table format to make you understand it in easier way.
| Attributes | QlikView | QlikSense |
| Launched in | It was launched in 1995; it is a legacy tool. | It was released in 2014, and is a modern BI and analytics platform. |
| Deployment Model | QlikView is primarily on-premises. | Qlik Sense has cloud-first deployment models including SaaS, multi-cloud, availability on premises. |
| Strategy | Its development approach is guided by analytics dashboards and reports created and controlled by the developers. | Its development approach is self-service drag-and-drop visualizations and ad-hoc exploration. |
| User Operating System | It is a classic, older UI and is not that responsive. It is made for desktop use. | This one is modern, responsive, touch-friendly and is taken in use for mobile and web. |
| Data Visualization | It is limited and needs more manual scripting for the charts. | This one has a rich visualization library, has AI-assisted insights and has drag and drop for visualizing data. |
| Preparation of the Data | QlikView is clearly scripting based, the QlikView script editor is for preparing data. | It is scripted and is combined with self-service data prep with drag-and-drop. |
| Authority | Has powerful IT governance, including centralized apps and controlled ones too. | This one is balanced and has IT governance and has self-service flexibility. |
| Integration | It primarily collaborates through static dashboards. | It has advanced collaboration like storytelling, data alerts, sharing and annotation. |
| Performance Speed | It is very fast with the in-memory engine. | Has the same associative in-memory engine, but is used for larger and hybrid datasets. |
| Portability | QlikView is limited and is only for desktops. | Qlik Sense is completely responsive and is made for tablets and smartphones. |
| Features of AI/ML | Features of AI/ML are not available in QlikView. | Has integrated augmented intelligence features in it, like Insight Advisor, natural language search and predictive abilities. |
| Expandability | Has limited extensions, and the customizations are done mainly through scripting. | Qlik Sense has open APIs and has a rich ecosystem of extensions and supports modern APIs and mashups. |
| Experience Curve | Its learning curve is steeper and needs scripting and developer expertise. | It is easier and has self-service, drag-and-drop but scripting is still supported here. |
| Permissions | Needs a named or usage license in it, and is an older model. | It has modern subscriptions like SaaS, professional vs analyzer users. |
| Vision | It is a legacy product and has no major latest development. | It is actively developed and is a future-focused product. |
| Finest At | It is good for tough, IT-driven enterprise reporting where the governance is censorious. | Qlik Sense is modern, has graceful analytics with business users exploring data independently. |
Qlik Sense is very well known for strong data exploration with its associative engine, sophisticated data integration and a robust focus on large-scale enterprise deployments. Whereas, Tableau is good for visually appealing, easy-to-make dashboards and superior interactive visualizations, especially for users who would rather choose a faster setup and drag-and-drop function. So, down here I have given a detailed differentiation between Qlik Sense and Tableau in a table format to make things easier for you to understand.
| Feature | Qlik Sense | Tableau |
| Release Year | 2014 | 2003 |
| Deployment Options | SaaS (cloud), multi-cloud, and on-premises | SaaS (cloud), on-premises, Tableau Online & Server |
| Target Users | Business users + IT teams (self-service + governed analytics) | Business analysts, data visualization enthusiasts |
| Ease of Use | Drag-and-drop with scripting for advanced users | Highly intuitive drag-and-drop, minimal coding needed |
| Data Engine | Associative in-memory engine – enables exploration in any direction | Relational model – requires predefined hierarchies/joins |
| Data Preparation | Built-in ETL features (data load editor, data manager) | Tableau Prep (separate tool for ETL) |
| Visualization Strength | Good visualization capabilities, but more focused on data exploration and associations | Best-in-class visualization, polished & presentation-ready |
| AI & Augmented Analytics | Strong: Insight Advisor (natural language queries, AI-driven insights) | Growing: "Ask Data" (natural language queries), AI/ML via Salesforce integration |
| Collaboration & Sharing | Robust governance, collaboration, and self-service balance | Strong collaboration, easy sharing (esp. in Tableau Online/Server) |
| Performance | Excellent on large & complex datasets | Great performance, but depends heavily on data source and prep. |
| Mobile Support | Fully responsive, mobile-friendly dashboards | Mobile app available, but some complex dashboards need adjustments |
| Pricing Model | Subscription-based (Professional, Analyzer, Capacity pricing) | Subscription-based (Viewer, Explorer, Creator licenses) |
This complete Qlik Sense tutorial covers all the key and imperative concepts of this platform. Learning about its architecture and enterprises is important for organizations to leverage Qlik Sense's prowess. This Qlik Sense tutorial is apt for beginners as well as experienced professionals. It gives an all-round insight into this platform, its architecture, capabilities and other aspects.
Explore More Resources:
FAQs
It's a data analytics platform used for data visualization, collaboration, reporting, data-oriented decision making and data integration.
The best way to learn Qlik Sense is by enrolling in a trusted online course.
Basic data understanding, Excel knowledge and analytical thinking are enough to start. Learning simple scripting later can help with advanced features.
Qlik Sense uses Qlik scripting language and JavaScript for data modeling, transformations and custom visualizations.
Qlik is not a traditional ETL tool but it performs ETL-like tasks such as extracting, transforming and loading data.
Course Schedule
| Course Name | Batch Type | Details |
| Qlik Sense Training | Every Weekday | View Details |
| Qlik Sense Training | Every Weekend |