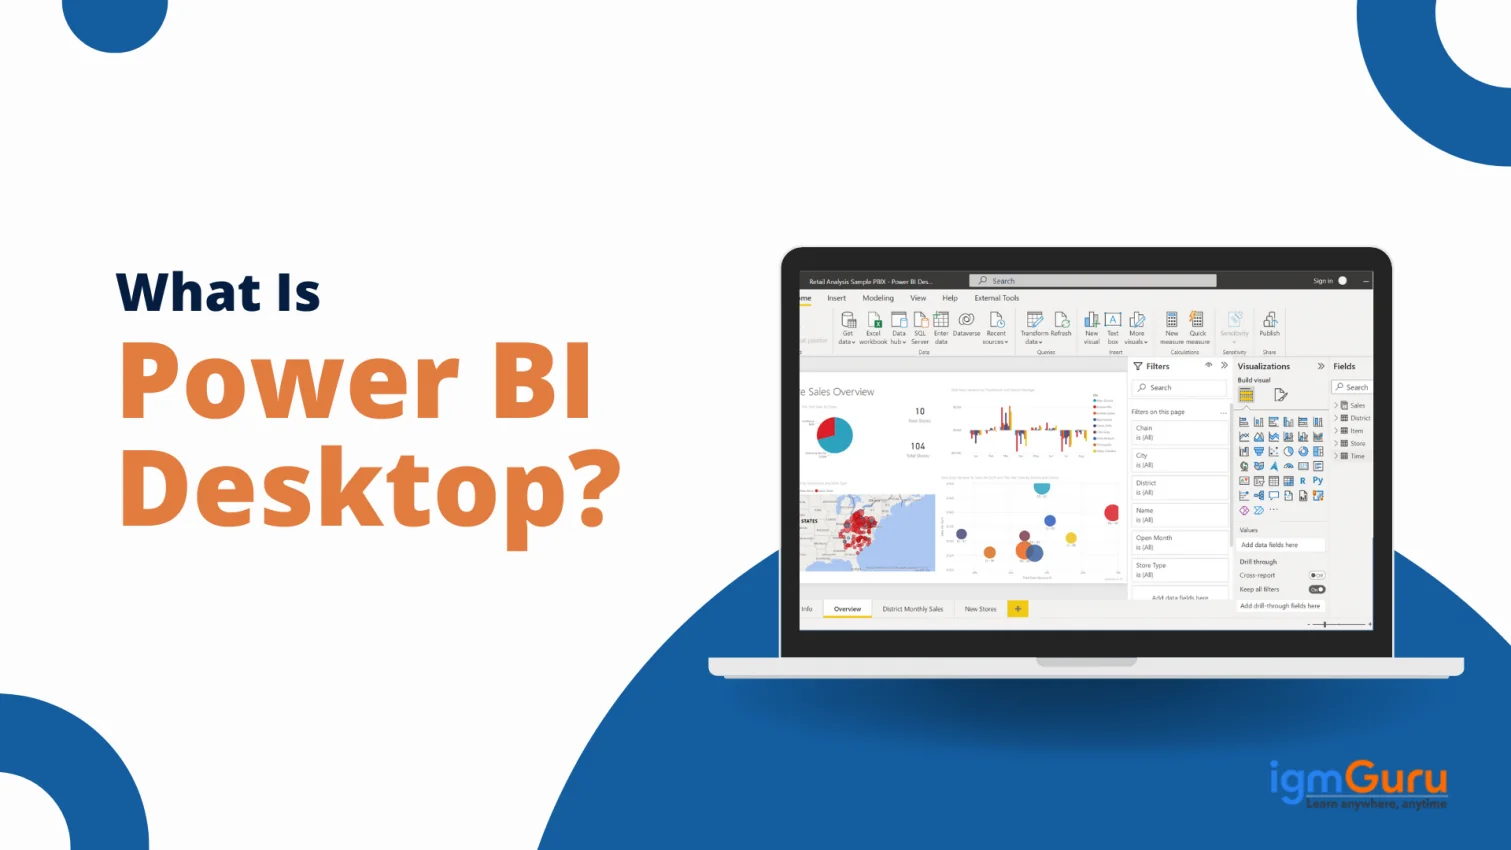
Power BI Desktop is one of Microsoft's most powerful Business Intelligence tools, designed to help users turn raw data into meaningful and actionable insights. Using this, businesses or professionals can easily connect a wide range of data sources, clean and shape their data, and build interactive reports and dashboards - all from one place.
Thanks to its simple drag-and-drop interface, anyone can create rich visualizations and detailed data models without needing advanced technical skills. No matter if you are a beginner or an experienced professional, Power BI Desktop makes it easy to explore and present your data clearly.
What makes it even more valuable is its seamless integration with other Microsoft tools like Microsoft Excel and Azure. This compatibility not only boosts productivity but also makes it an ideal choice for professionals working across different data environments.
Want to learn Power BI Desktop? Enroll in our Power BI course today.
Power BI refers to a suite of business analytics tools. It is developed by Microsoft and is crafted to aid companies in analyzing data and sharing insights thereafter. It converts raw data into visually appealing and interactive dashboards and reports. All this enables users to take action on data-driven insights.
Power BI also seamlessly integrates with many data sources. This includes databases, Excel, on-premises systems and cloud services. This offers a unified view of all important business metrics. Main components of this tool are Power BI Desktop, Power BI Service and Power BI Mobile.
Power BI Desktop refers to a comprehensive app to create reports. Power BI Service is an online SaaS platform for collaboration and sharing. Power BI Mobile allows users to successfully access dashboards and reports on mobile devices. It also offers features such as natural language query, real-time data updates and data modeling. Thus, making it an impeccable solution for data analysis.
It has exceptionally robust and user-friendly interface capabilities. These abilities help Power BI in empowering IT professionals, developers and business analysts in creating data-driven solutions. It is a preferred pick for companies wishing to utilize data for strategic advantage because of its integration ability and strong community support.
Power BI Desktop pertains to a robust visualization and data analysis tool. Developed by Microsoft, it is crafted to create interactive dashboards and reports. This desktop app enables users to seamlessly connect to many data sources. These include Excel files, cloud services and databases. The consequent action is enabling comprehensive data integration.
Users can easily perform data cleansing and transformation via its powerful query editor with Power BI Desktop. It supports many data manipulation tasks to help prepare the data for analysis. This tool also boasts a drag-and-drop interface, which helps in the curation of complicated data models. This allows users to cement relationships between various data sets and craft calculated measures and columns.
Another standout feature of Power BI Desktop is how it produces rich and interactive visualizations. Users can easily pick from many visualization options. These include graphs, charts, custom visuals and maps. These help in representing the data effectively. Power BI Desktop supports the usage of DAX (Data Analysis Expressions) to carry out advanced data manipulation and analysis.
After the creation of reports, they can easily be published to the Power BI Service to be shared across the organization. Hence, there is seamless integration between Power BI Desktop as well as online services. This integration ensures users are able to use the data to its full potential. It drives strong decision-making and better strategic insights.
Related Article- Power BI Tutorial for Beginners
It enables users to seamlessly connect to various data sources. The purpose is to transform data, produce interactive reports and dashboards, and create sophisticated data models. Let's see how Power BI Desktop works-
It supports multiple data sources such as databases, cloud services, Excel files and others. Users can easily import data from such sources via a user-friendly interface. After being connected, it retrieves the data, which allows users to begin their analysis.
Once the data is imported, Power BI Desktop offers a robust query editor to help clean and transform the data. It's crucial to ensure data relevance and quality. Users can carry out multiple operations like merging datasets, filtering rows, creating calculated columns and removing duplicates. Power Query is used to offer a flexible way to reshape data via an intuitive interface.
It enables users to create relationships between various datasets. This forms a comprehensive data model, which is the basis for all visualizations and analyses. Users can create hierarchies, establish calculated measures and define relationships via DAX. These calculated columns and measures aid in extracting insights, initially not directly available in the raw data.
Its strengths lie in its ability to create interactive visualizations. Users can easily drag and drop fields to the report canvas. This enables creation of various visual elements like graphs, charts, tables, custom visuals and maps. The visualizations are customizable and formattable to meet required needs.
Users can easily publish it to the Power BI Service (Microsoft's cloud-based platform) when the report is ready. This helps in easy collaboration and sharing within the organization. Published reports are accessible through mobile apps or web browsers. These can also be embedded in other websites or applications.
It supports continuous integration with multiple data sources. This means that reports are easily set to refresh automatically as soon as new data is available. This makes sure that users have access to updated information at all times.
It integrates seamlessly with organizational security protocols. Hence, it ensures data compliance and privacy. Data encryption and role-based access controls are key features that aid in maintaining governed and secure data environments.
Power BI Desktop isn't just for tech experts or data professionals - it's for anyone who wants to explore data, build dashboards, or just try out Microsoft's powerful (and free) data visualization tool. Anyone can download and install Power BI Desktop in just a few easy steps - no special skills required. But before getting started, checking system requirements is essential to make installiatio process hassle-free.
Before installing, make sure your system meets these basic requirements:
Operating System: Windows 10 or Windows 11 (64-bit is recommended)
.NET Framework: Version 4.7.2 or later
Memory: At least 4 GB RAM (8 GB or more is better for large data sets)
Storage: Around 1 GB of free space
Explore our detailed guide on how to install Power BI Desktop.
Getting started with Power BI Desktop requires you to connect the data with its interface. Let’s take an instance where we will connect an Excel Spreadsheet as a sample data source. It can be downloaded from the Microsoft documents.
You can also use any other data source as per your preference. Here we are creating a report from an Excel spreadsheet.
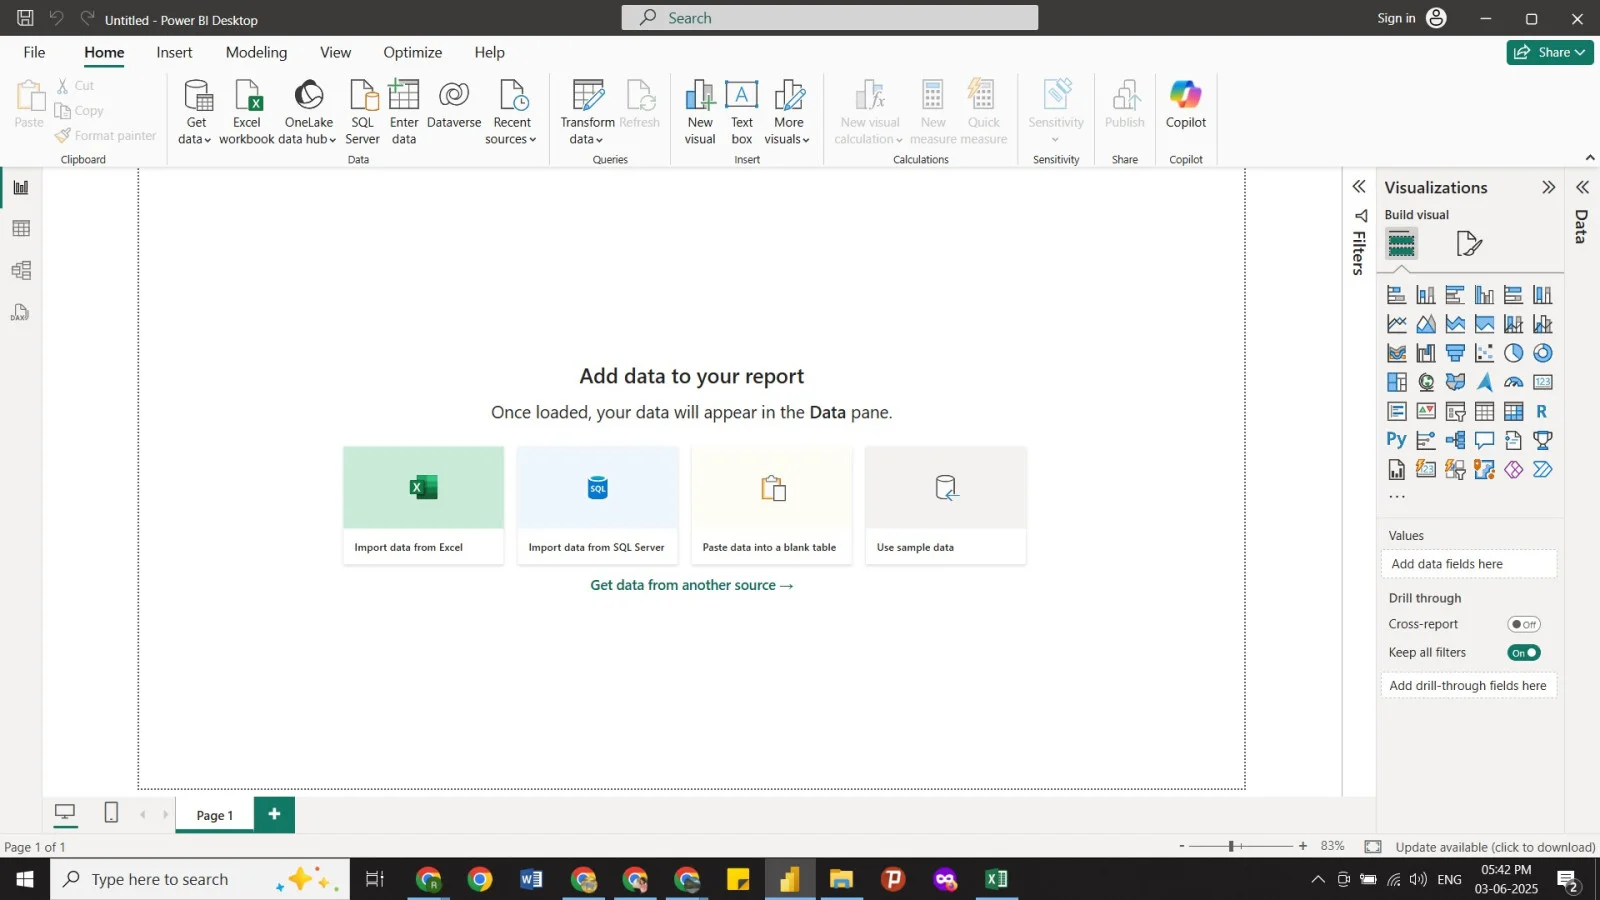
1. Open the Microsoft Power BI application in your system and select the appropriate data source to import data. You will have many options on your screen as given below. We are selecting the Excel spreadsheet.
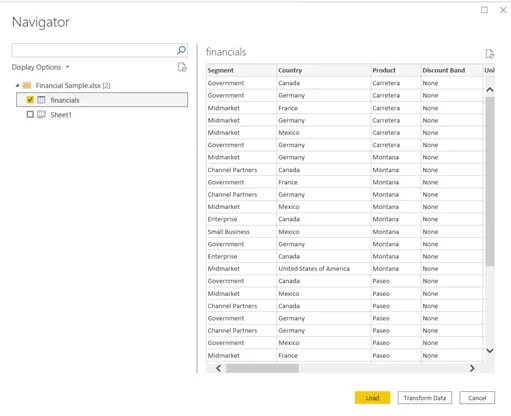
2. Now, the system will automatically import all the data from the selected file. Once done, you will be prompted to a navigator window showing all the data. Here you can apply different operations to make it ready for further use. Click on the Load button once it is ready.
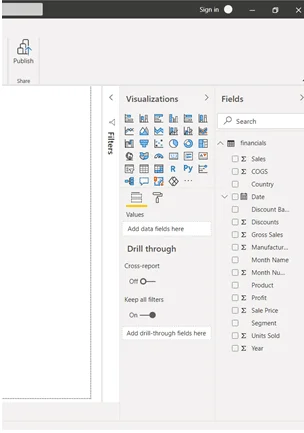
3. Now you will see multiple columns from different datasets as an icon that represents their data type on the right side of your interface. For instance, the sales column will have a sigma icon showing numerical type or the date column will have a calendar icon.
4. Next, use the AI feature to interact with data sets. It is as simple as talking due to its query-based natural language approach. Do it by double clicking on the Power BI interface. It will show a dialogue box with a search bar where you can write your queries.
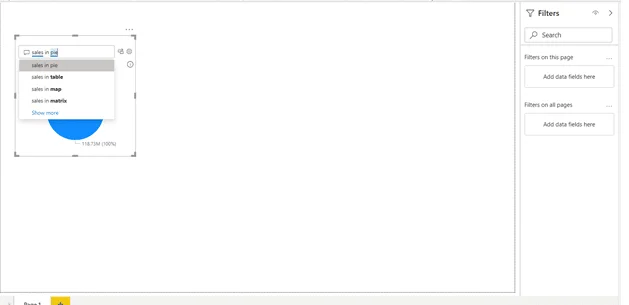
5. Here you can type the name of the visual you want to add, such as the column type, graph type, etc. For instance, to build a pie chart showing Sales data from different countries, you will need to type sales country pie. Then, select the Turn this Q&A into a standard visual option.

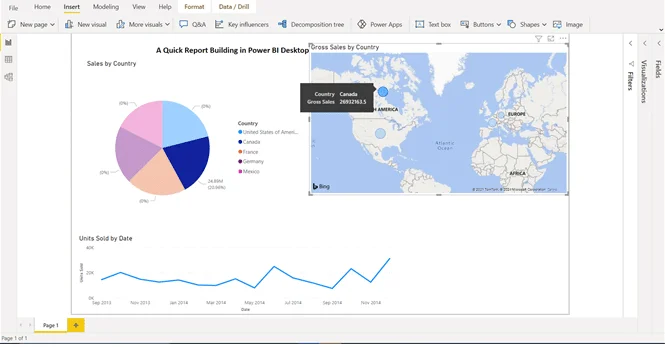
6. You can also filter these visuals to represent details according to different constraints. The image given below is an instance of this case that shows the Gross Sales of Canada whereas the other visuals are highlighting the sales for a particular region.
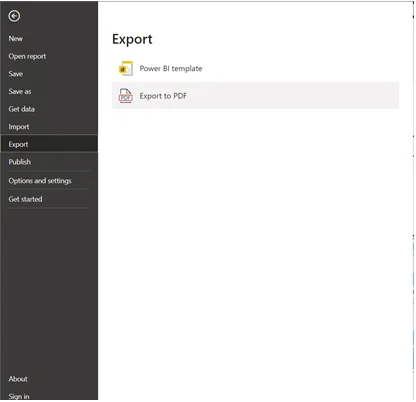
7. Once you are done with adding or customizing the visuals, export the file as Power BI template or PDF.
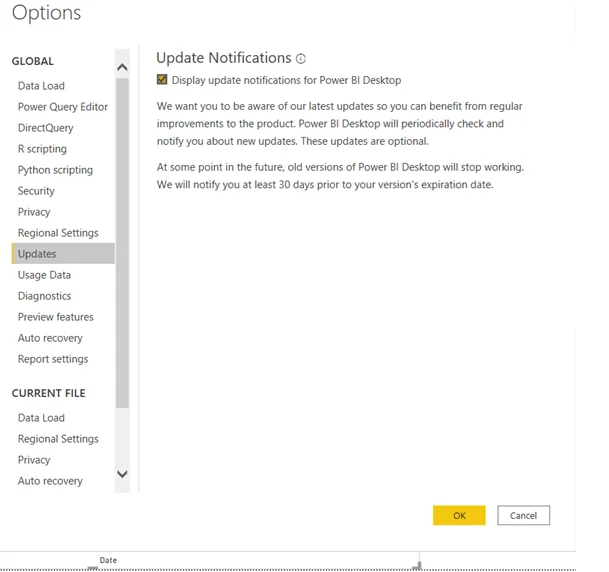
Microsoft Power BI is by many individuals and organizations all around the world. To satisfy and not lose any customers, it keeps updating with new features, capabilities and connectors almost every month. If you have installed the Power BI software from the Microsoft Store, it will automatically update itself. In case you have installed it manually, consider the following steps to update it:
Power BI Desktop stands out as a truly transformative tool in the realm of business analytics. Far more than just a reporting application, it is a comprehensive environment designed to empower users at every level to harness the full power of their data.
We have seen how it enables you to connect, clean, model, and visualize data with remarkable ease. With all these capabilities it has become a necessity to master Power BI Desktop. It is the right time to unlock a world of possibilities for your data and your career with this platform.
Yes, Power BI Desktop is free to download and use. It allows you to connect to data sources, build reports and share them with others who have a Power BI license without actually purchasing one.
Its primary purpose is to provide a free application that can connect, transform and visualize data from different sources. Further, it has many more advanced capabilities too, such as report sharing, data analysis and more.
Yes, you can use it offline to create, edit and save reports. However, it will require an Internet connection for sharing and publishing the reports.
Explore Our Trending Articles:
What Is Power BI Dashboard- Design with Examples in 2026
What is Data Visualization? A Complete Guide for Beginners
What is Power Query? A Complete Guide for Beginners
Power BI Interview Questions And Answers
Course Schedule
| Course Name | Batch Type | Details |
| Power BI Training | Every Weekday | View Details |
| Power BI Training | Every Weekend | View Details |